This post is an extension of the previous post but with the spheroid surface brightness profile in the H band this time.
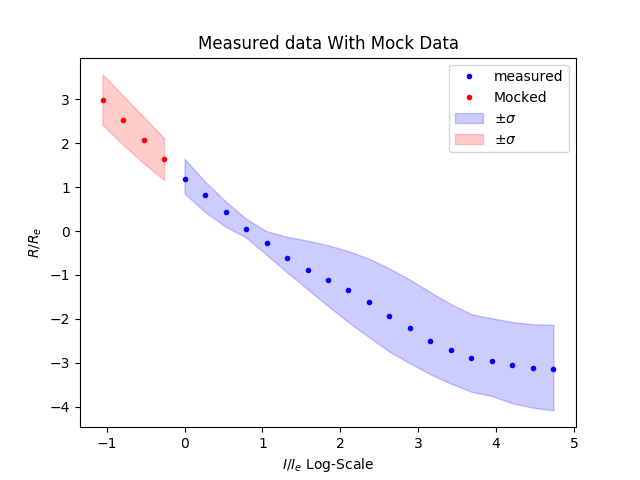
To make the mock data we fit two lines. The first was a second degree polynomial to the median values and the second line was a simple line to the first three values in the $84^{th}$ percentile.
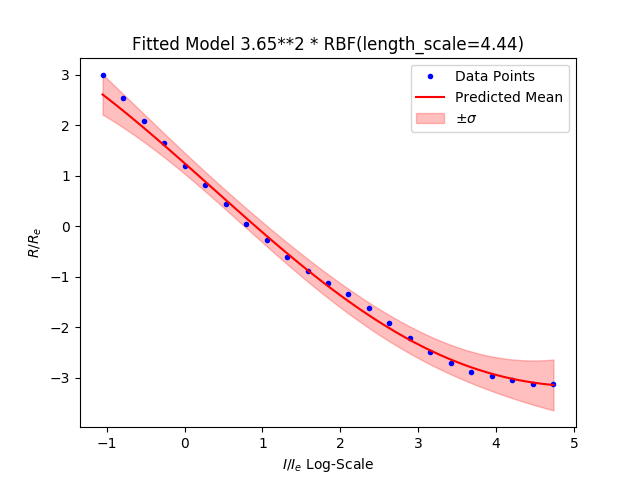
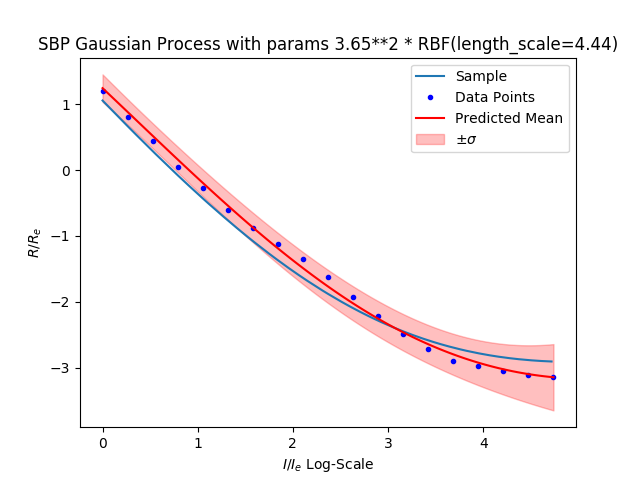
The new fitted function looks like this:
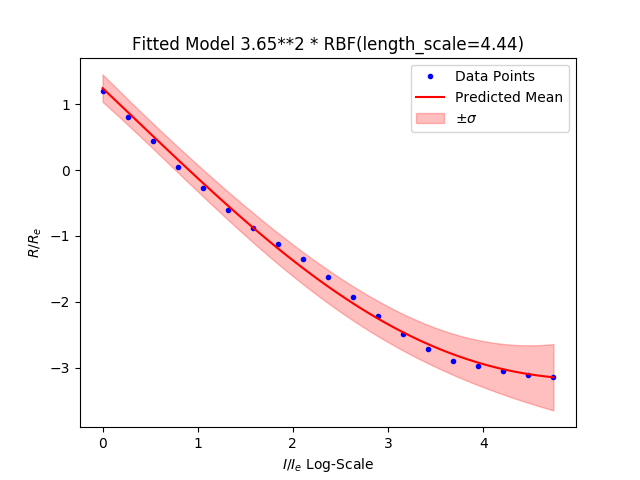
And at the same zoom:
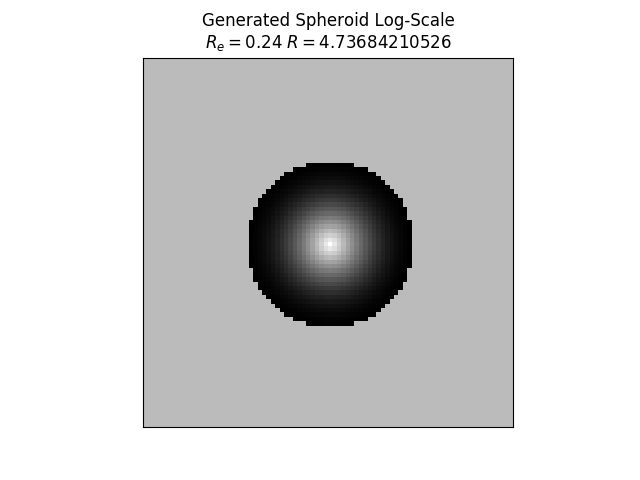
This looks much better here is a generated image:
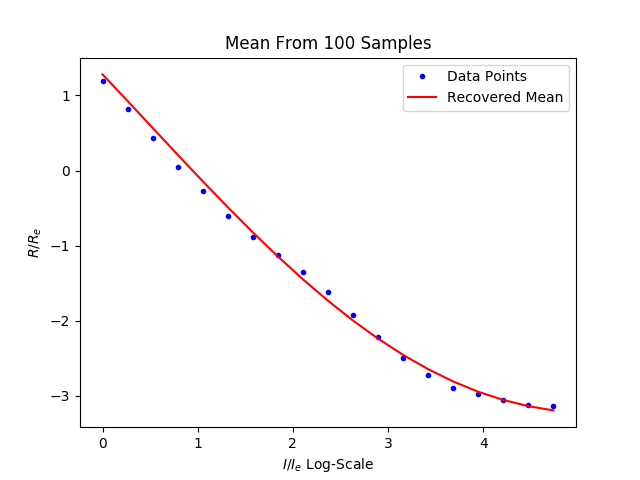
The recovered mean:
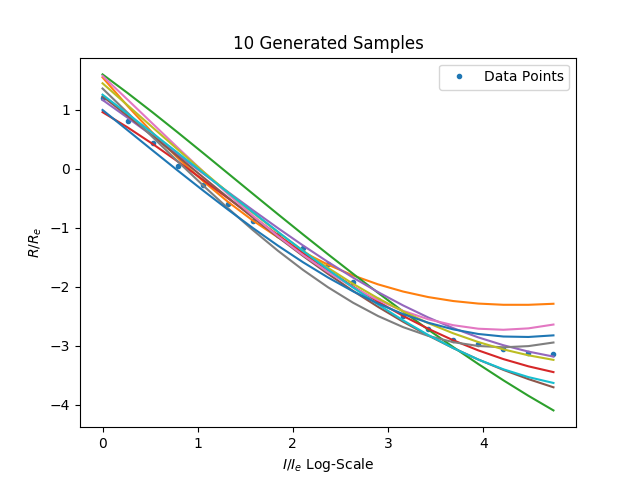
Samples from the fitted process: