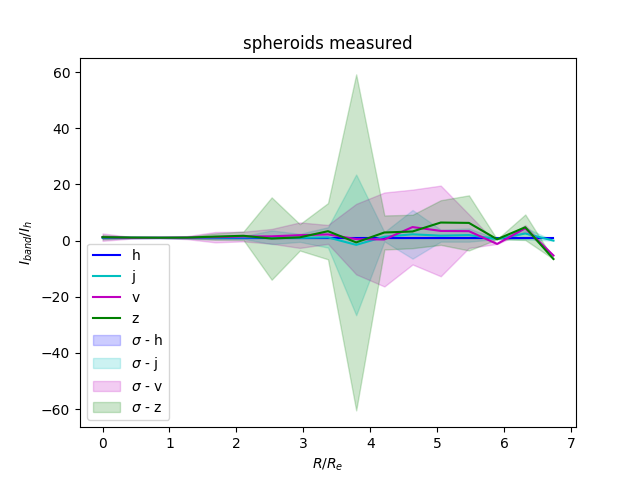
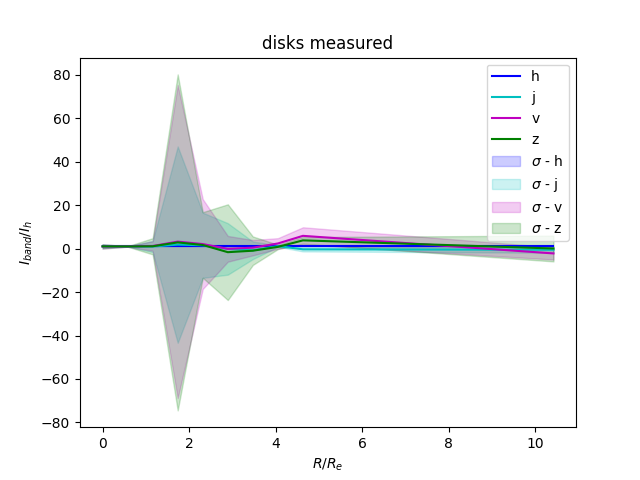
Color Band Ratios
For each source we take the surface brightness profile normalized to $I_e$ and $R_e$ in each band of light and meausre as a ratio to the H band. This gives a distribution of color ratios per normalized radial value. These are seprarted into 20 bins. This graph shows the mean and the mean plus-minus one standard deviation:
Gaussian Process Fitting for Color Band Ratios
With these values we fit this output to a Gaussian Process. The $\alpha$ parameter of the gaussian process by which we indicate datapoint specific noise has only a single dimension, so I take the mean of the standard deviation of the three ratios for that parameter. The output looks like this:
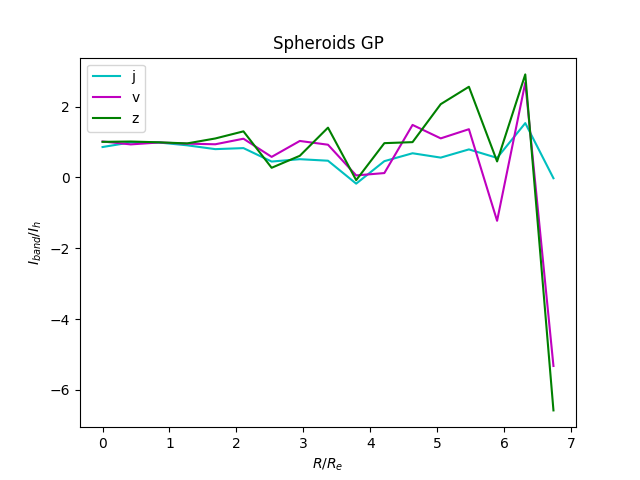
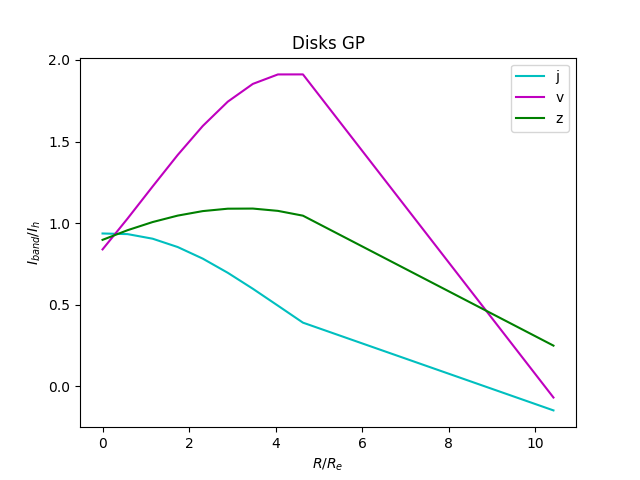
The kernel function produces a covarince between our $x$ points, so I am still looking into how to visualize/interpret those values.
A Realization of Gausssian Process Fit To Color Band Ratios
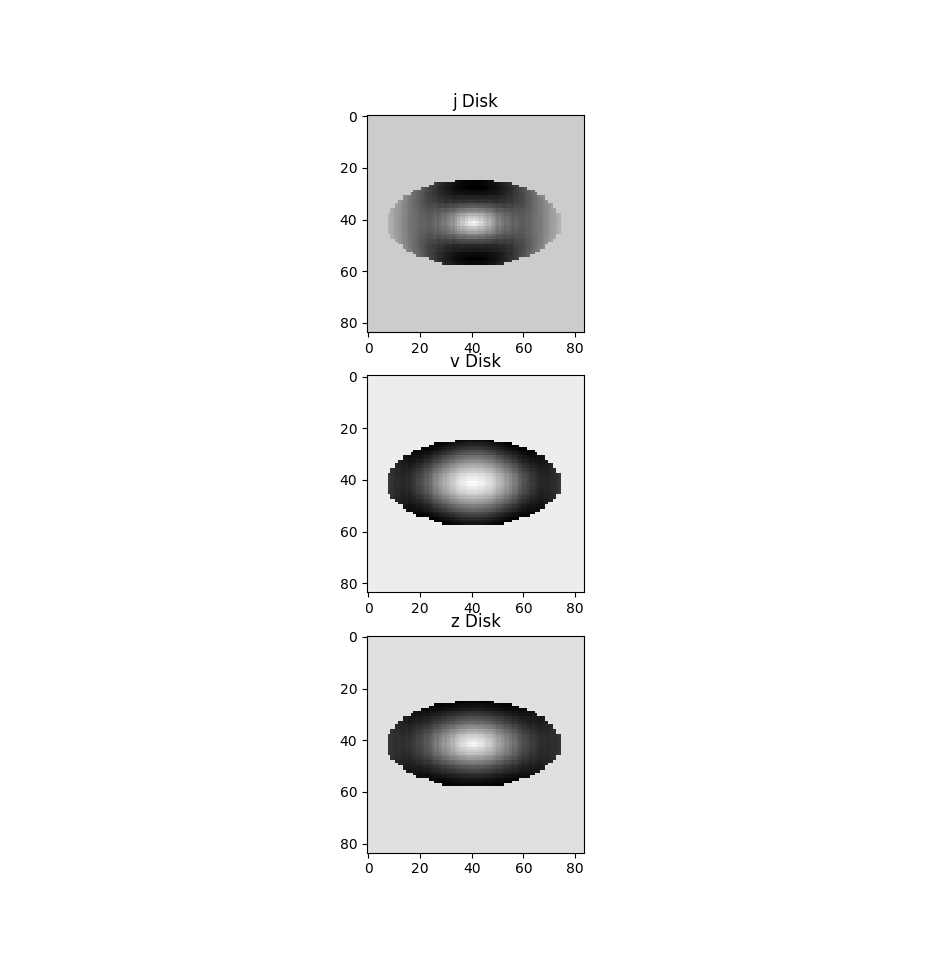
Using the Gaussian Process from the previous post we can sample an image, then using the Gaussian Process that is fit to the color ratio, we can modify the image to match the sample.
For a disk starting in h band:
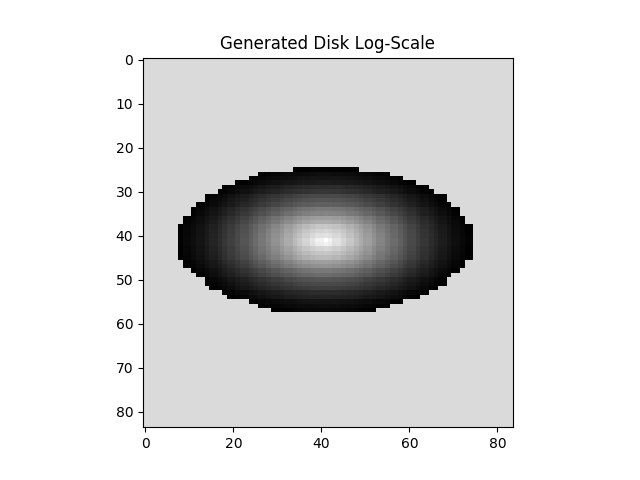
applying the mean prediction of the Gaussian Process to other bands: