Updated Graph
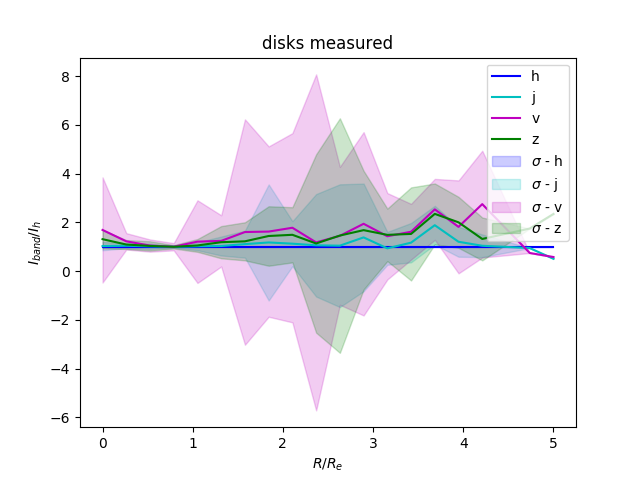
After getting noisy results from the first run. I rexamined the algorithm I wrote and found some bugs and also some interesting artifacts in the data. After fixing the bugs and adding a new rule to exclude images where the centroids between different bands are more than 8 pixels away. The new color profiles look like this:
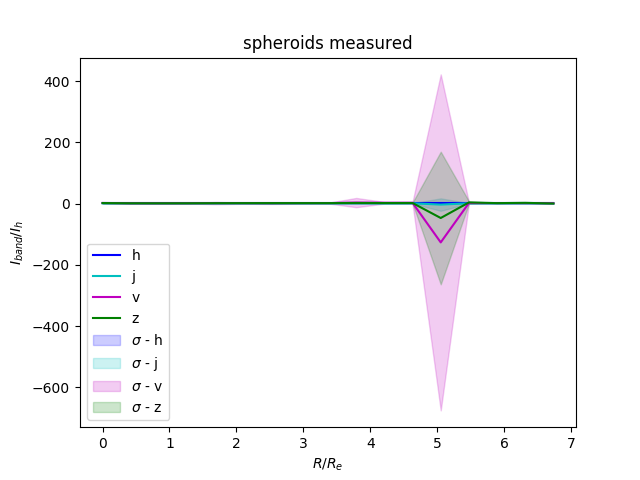
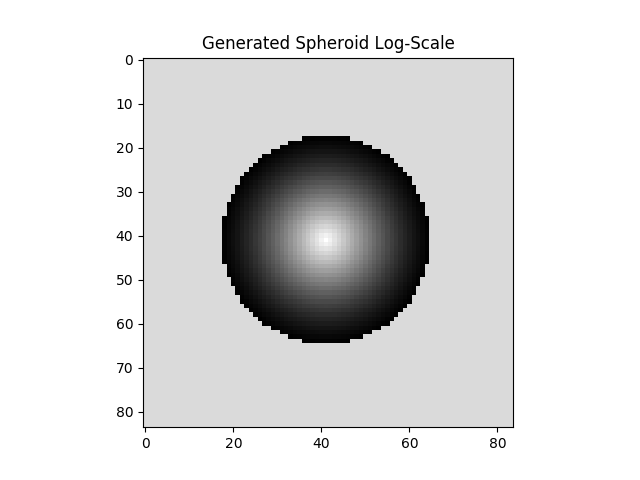
There is a considerable amount of noise just after 5 effective radaii in the spheroid profile. If we look at the histogram for that radial bin of values we see that there is a single outlier causing the problem:
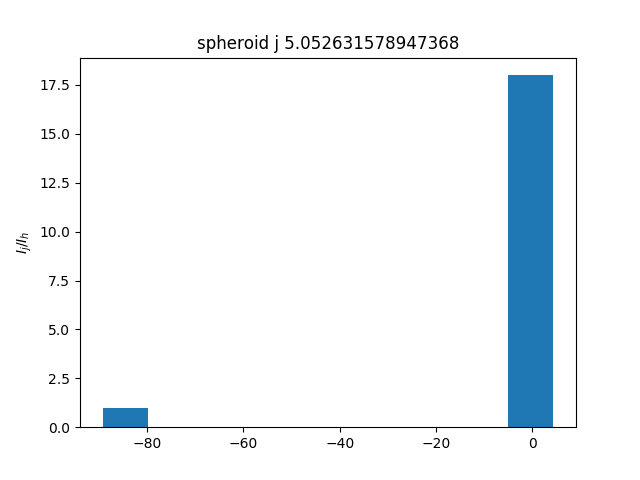
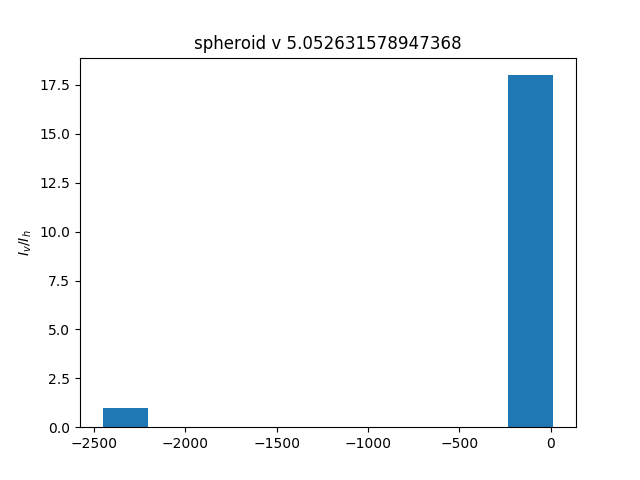
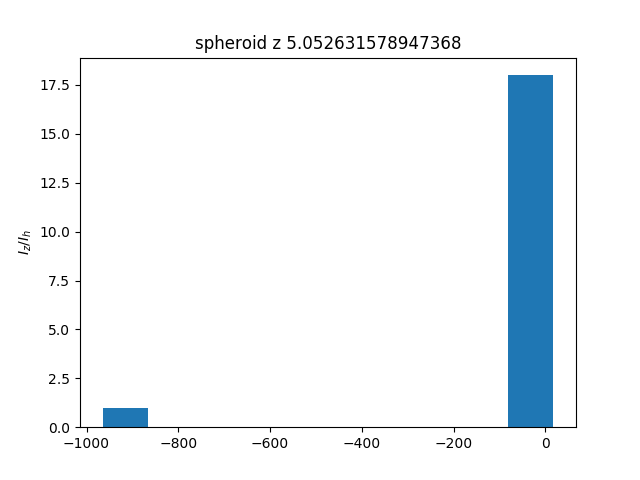
To remove that outlier I added a new rule to exclude sources where the absolute value of the color ratio value is greater than 10. With that new condition we get the following new spheroid profile:
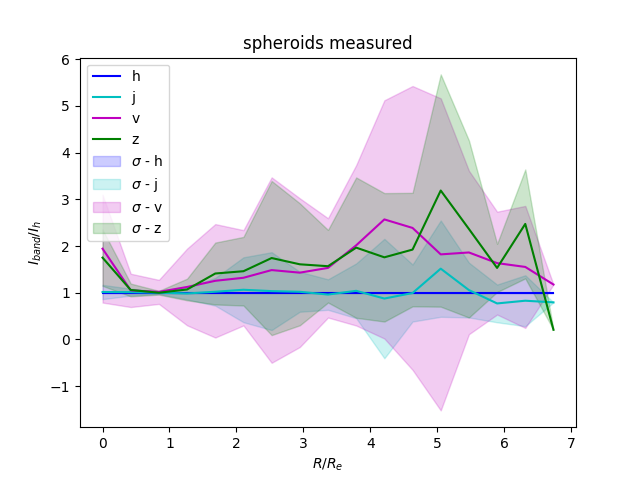
We then train a GP on the data from which here are the mean values:
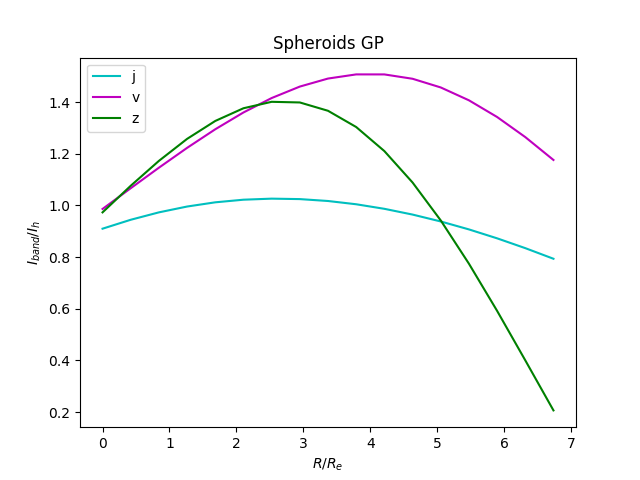
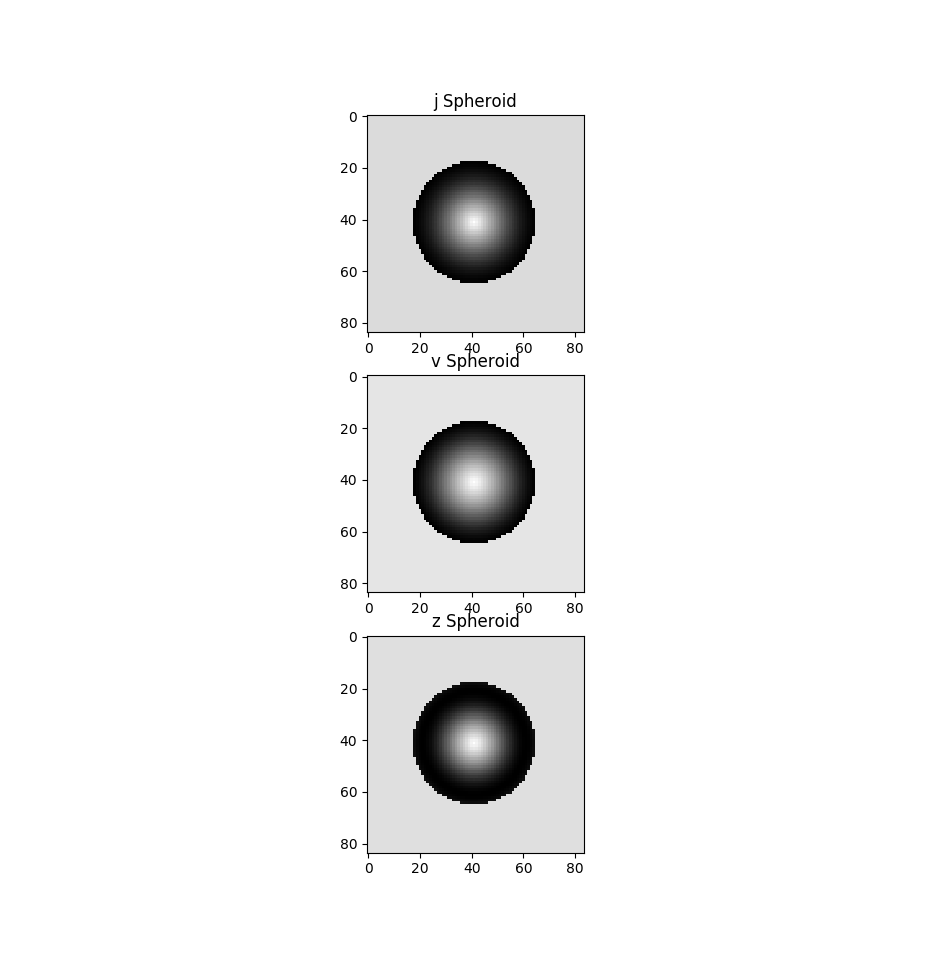
The sudden rise in the z band nearing 5 times the effective radius is peculiar but fits the measured data that was used for the GP. However I think that this probably an artifact of noise or other sources as we are pretty far out from the original source in the image by 5 times the effective radius.
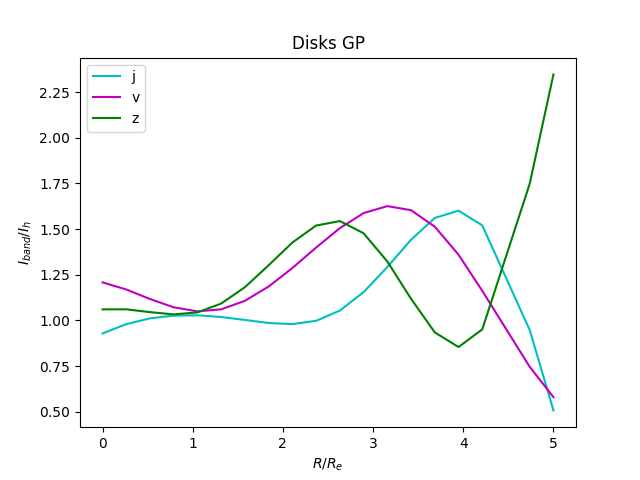
If we take the synthetic images from the last post that were samples drawn from GP trained on data in the H band and then apply the ratios from the new GP we get the following results.
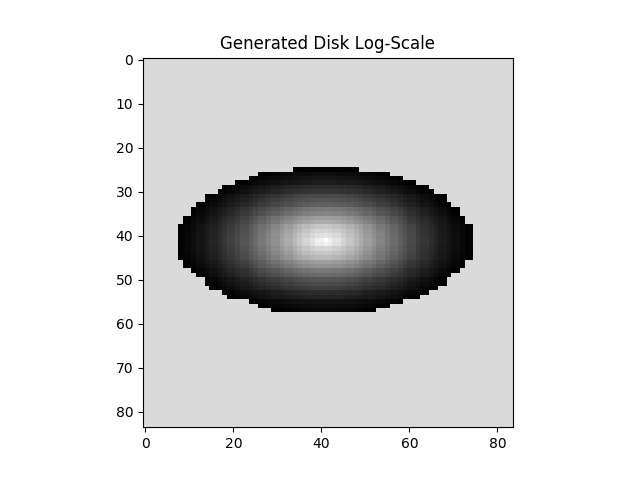
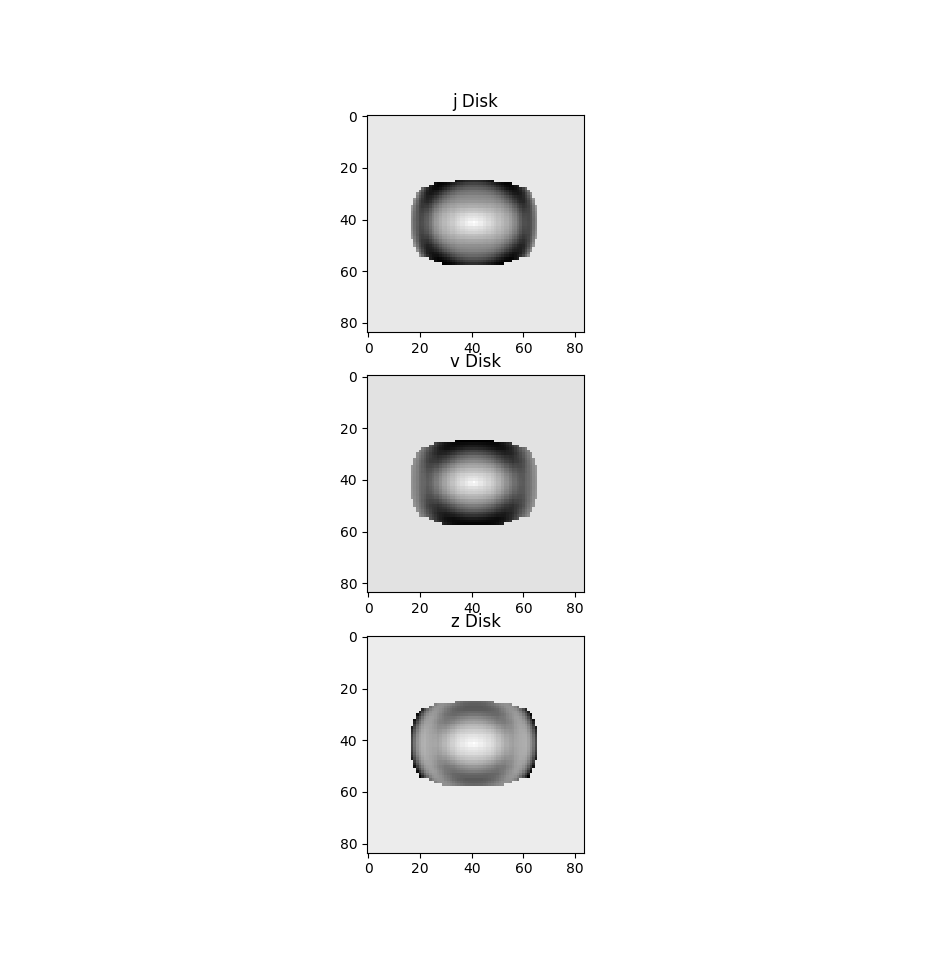
Further Thoughts
The effects of the odd trend in the disk GP to an increase in intesity at 5 effective radaii makes the images less than believable. I am not sure whether the data should be reexamined or if just some constraints should be placed when we draw samples from the process to ensure realistic images.