Images of V-Band Outlier
Ordered by V-band signal = $\sum_{r=0}^{I_e}I_r$, descending
wide2_386

ers2_14166

ers2_14166
ers2_15757

ers2_16767

Ordered by V-band signal = max(vband-img)
wide2_1468

ers2_12623

ers2_14546

deep2_10673

ers3_12930

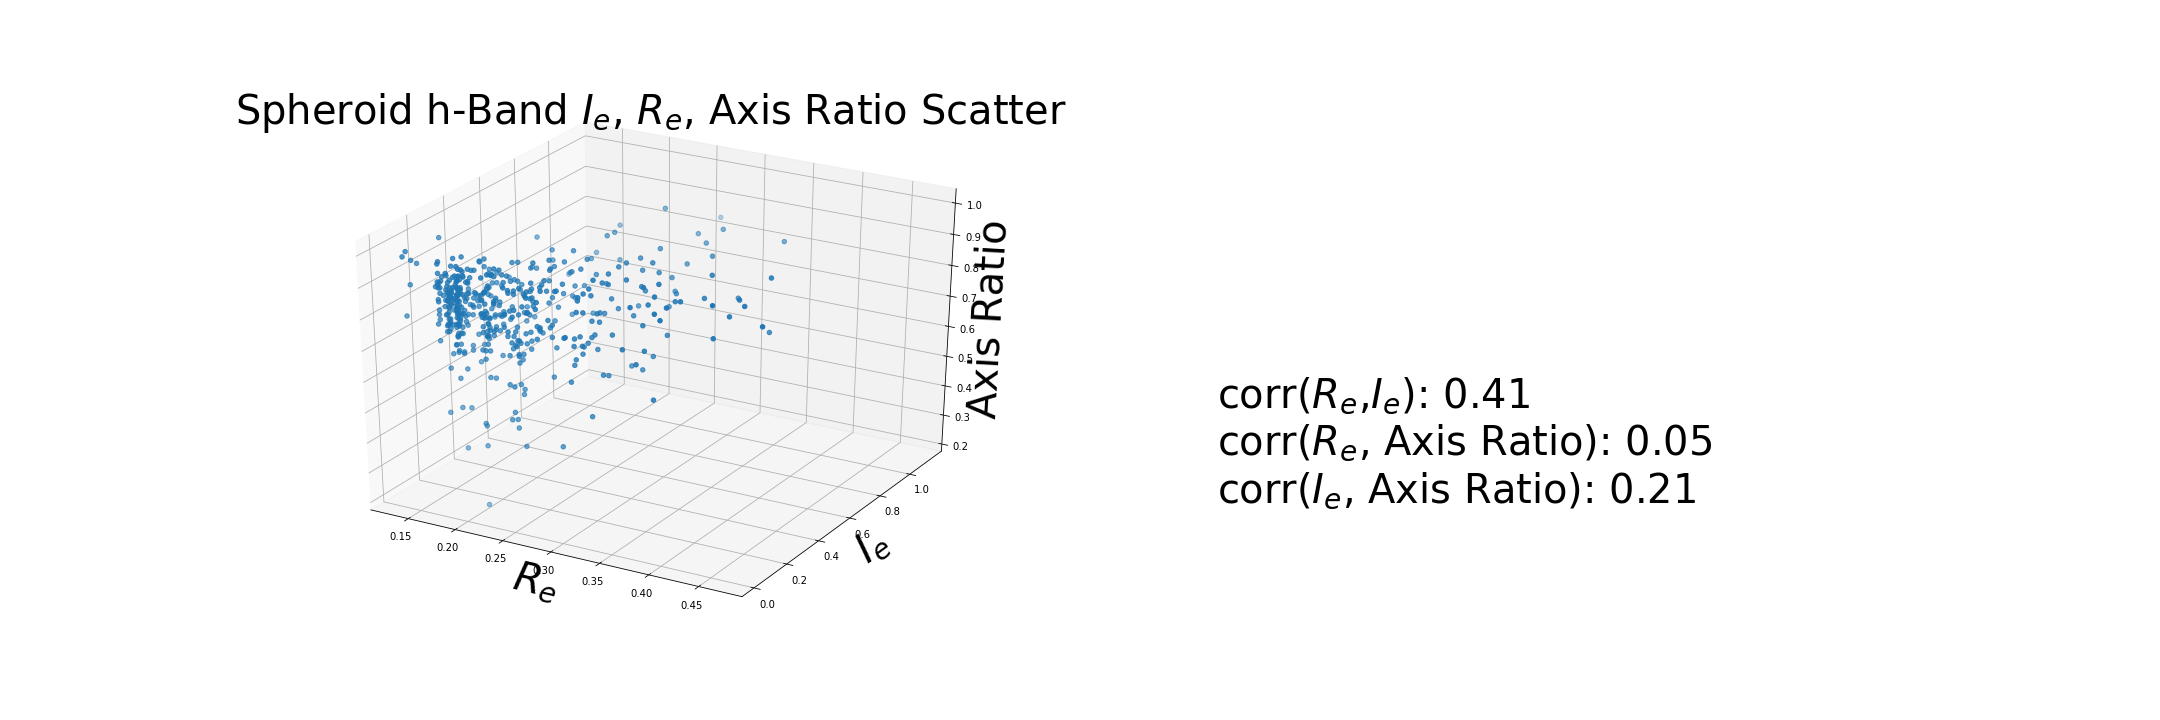
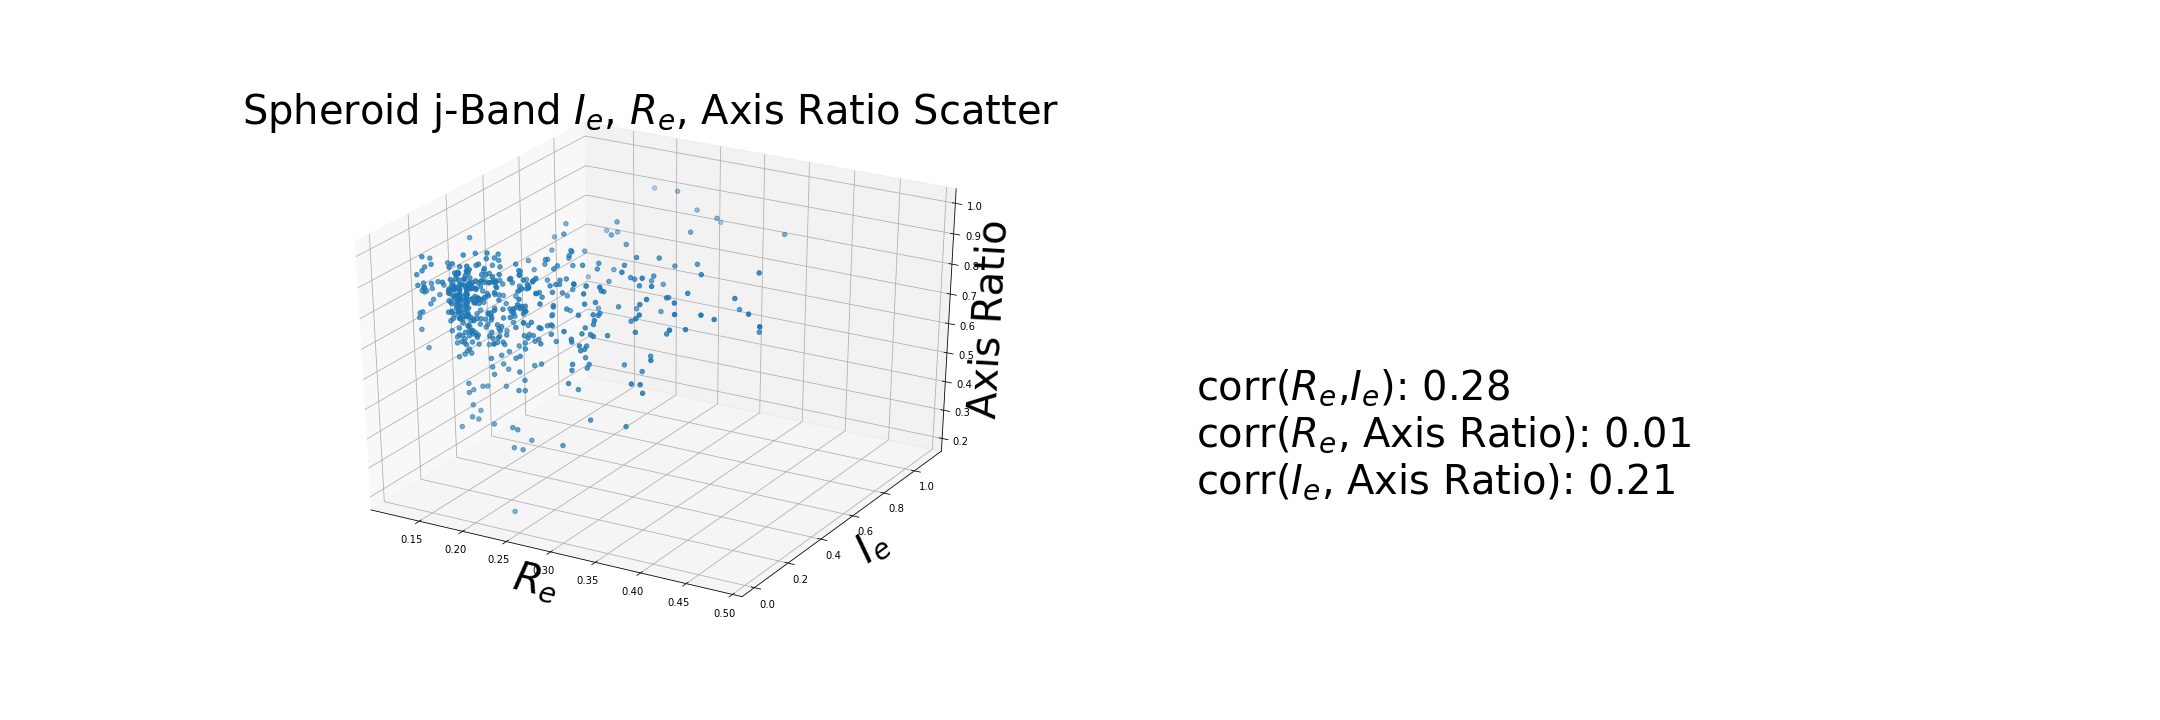
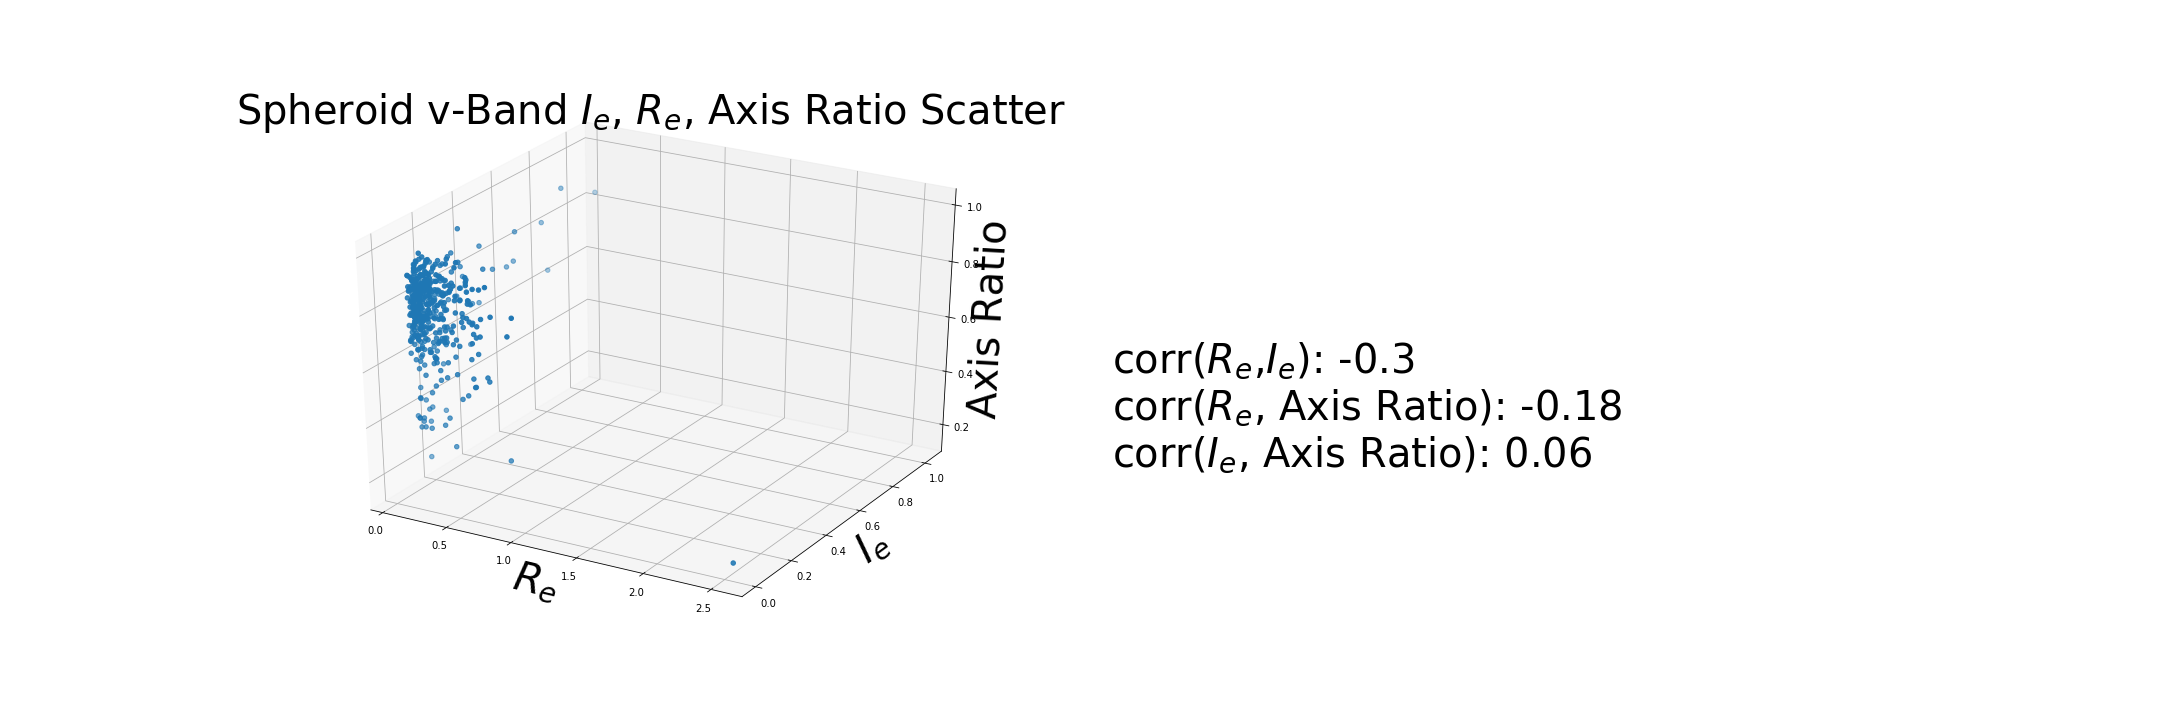
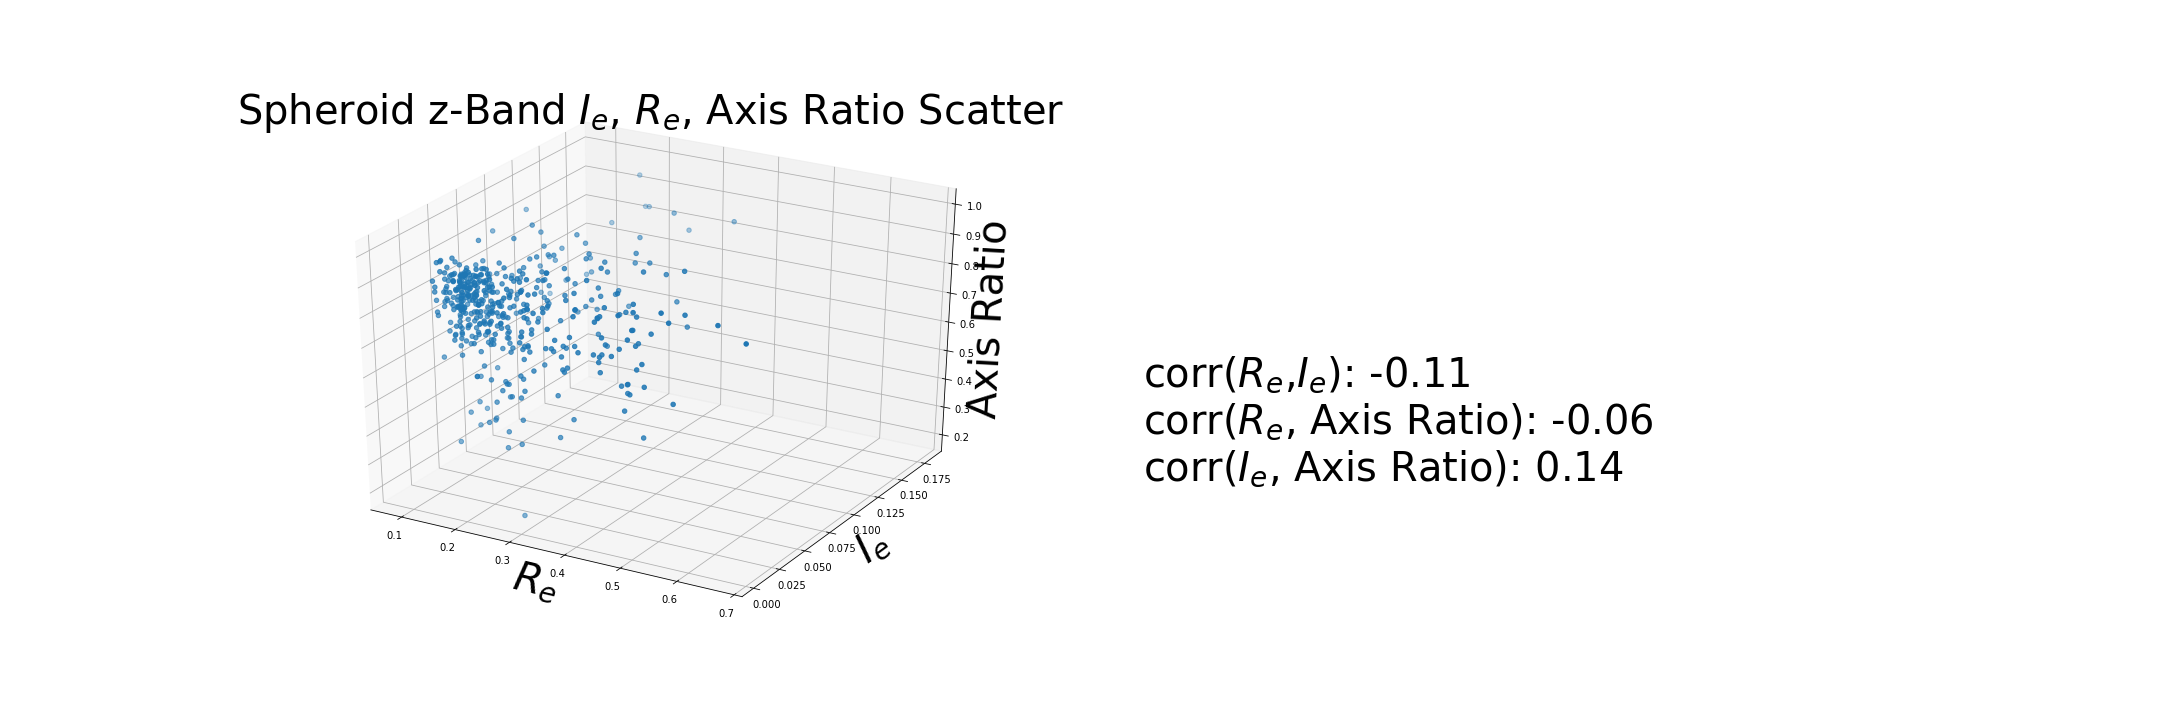
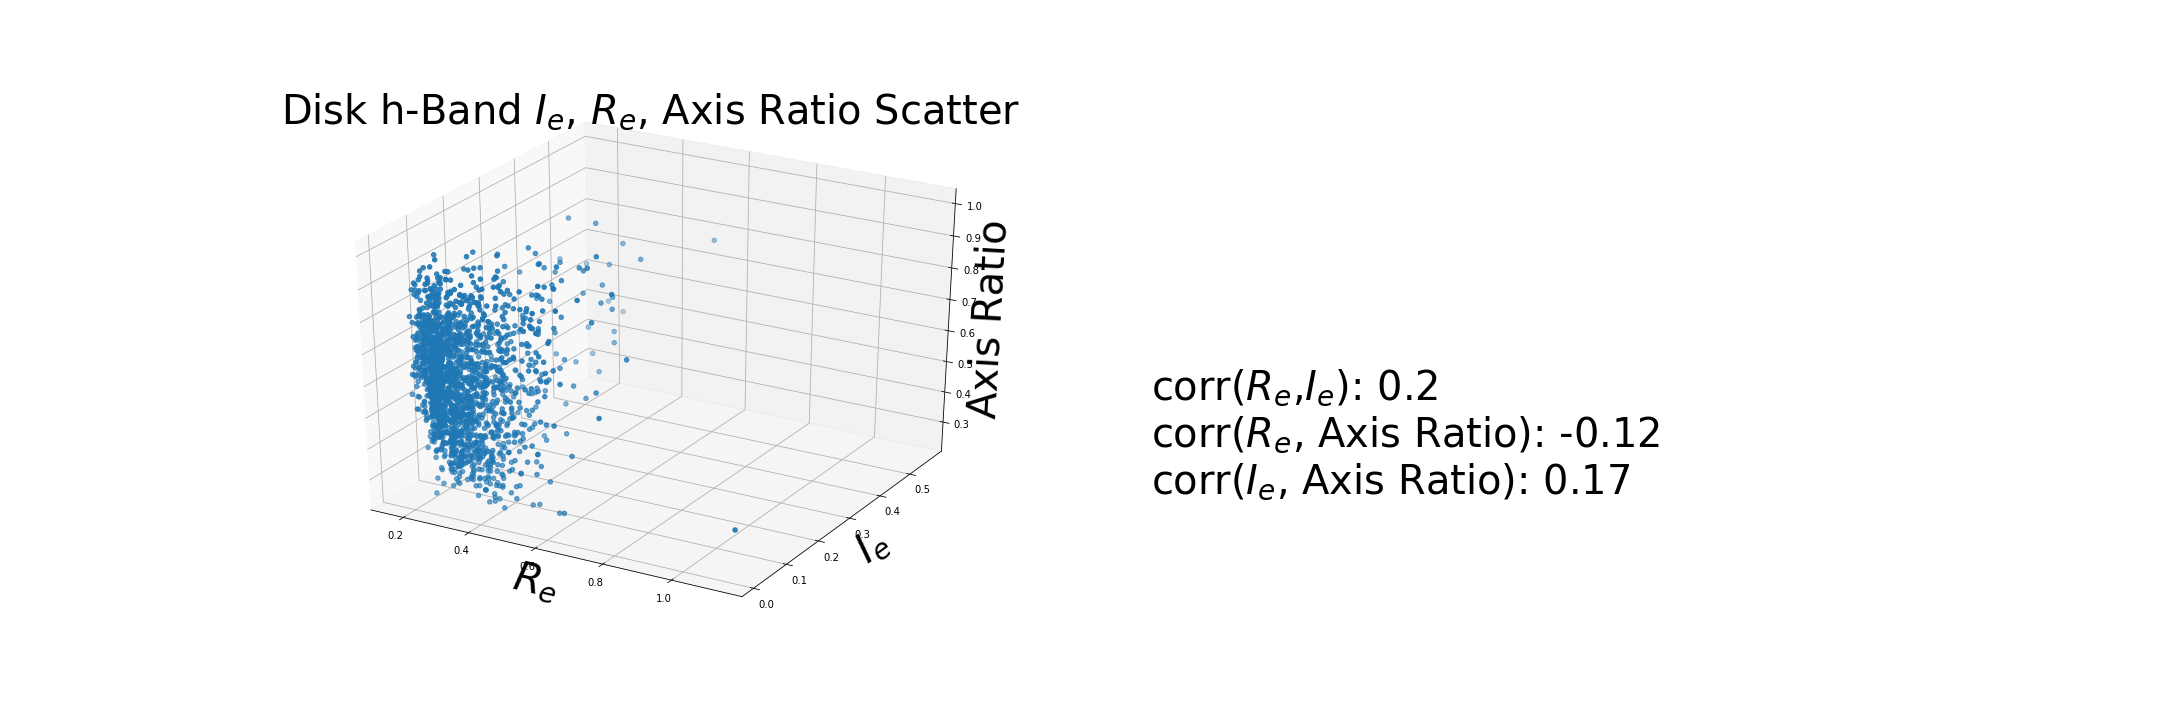
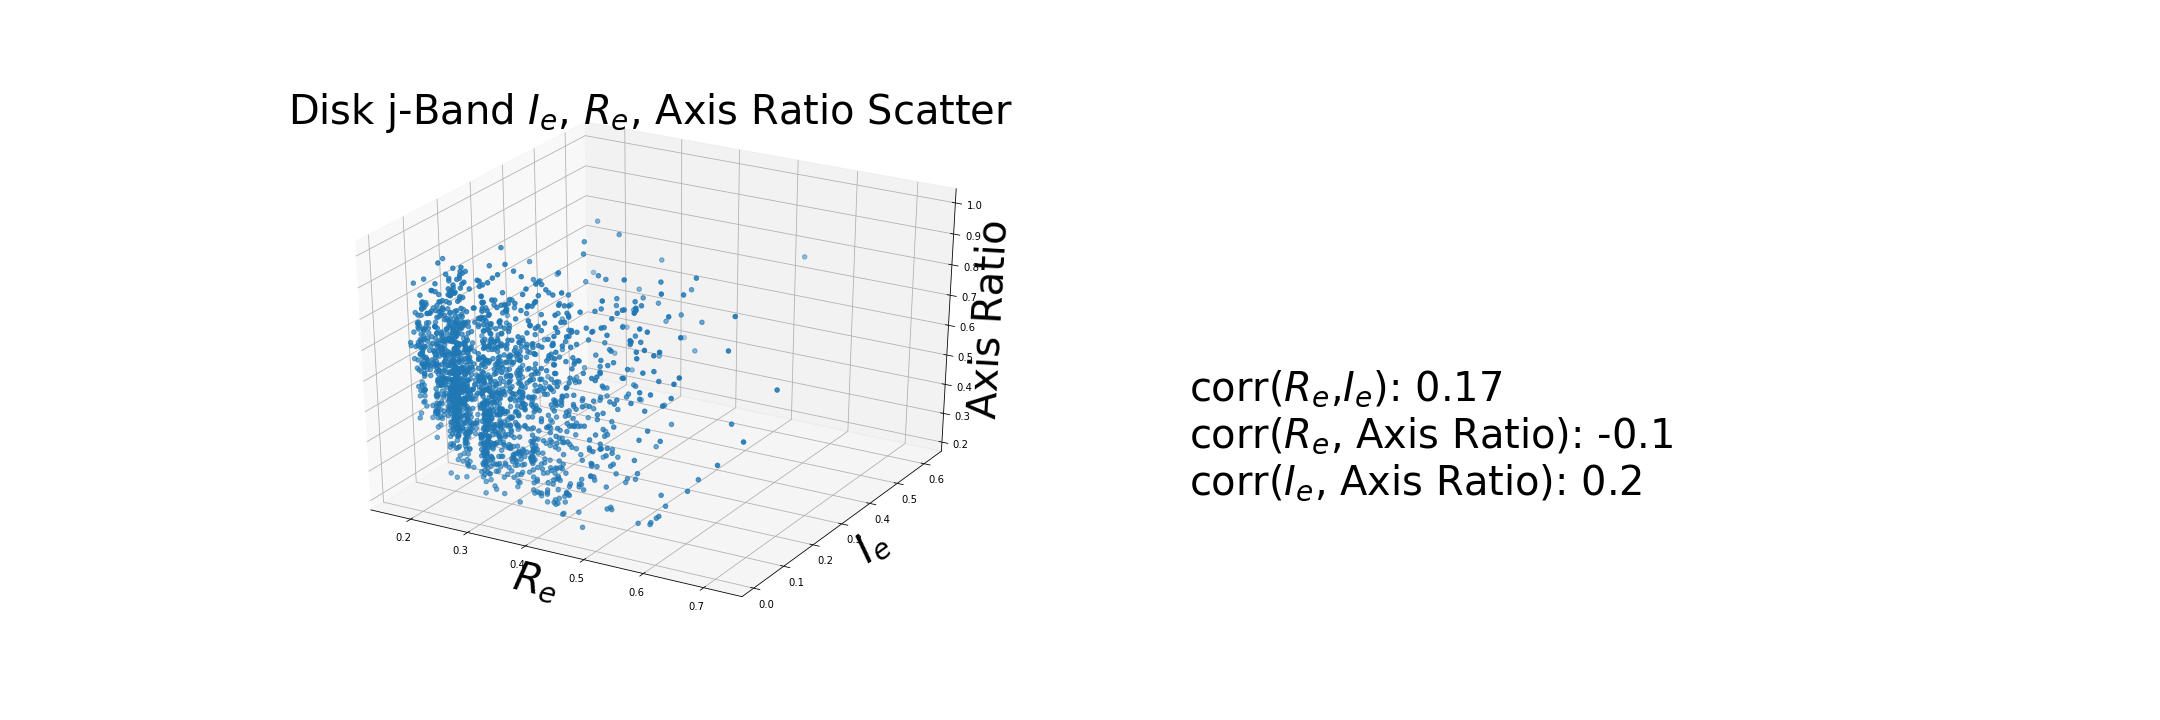
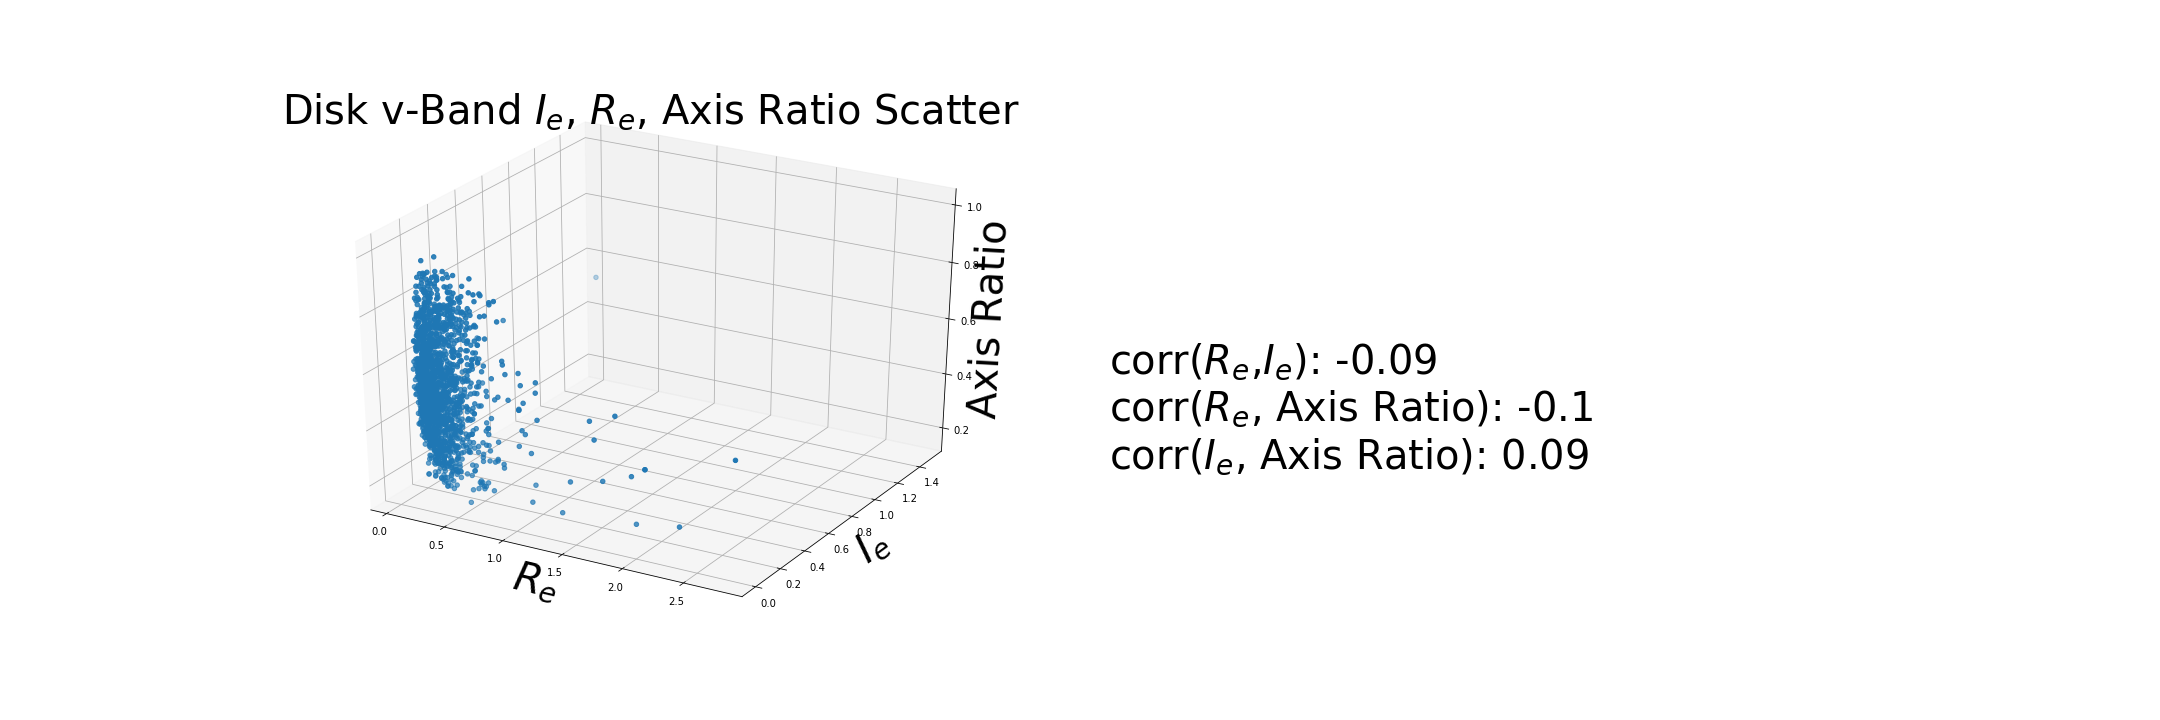
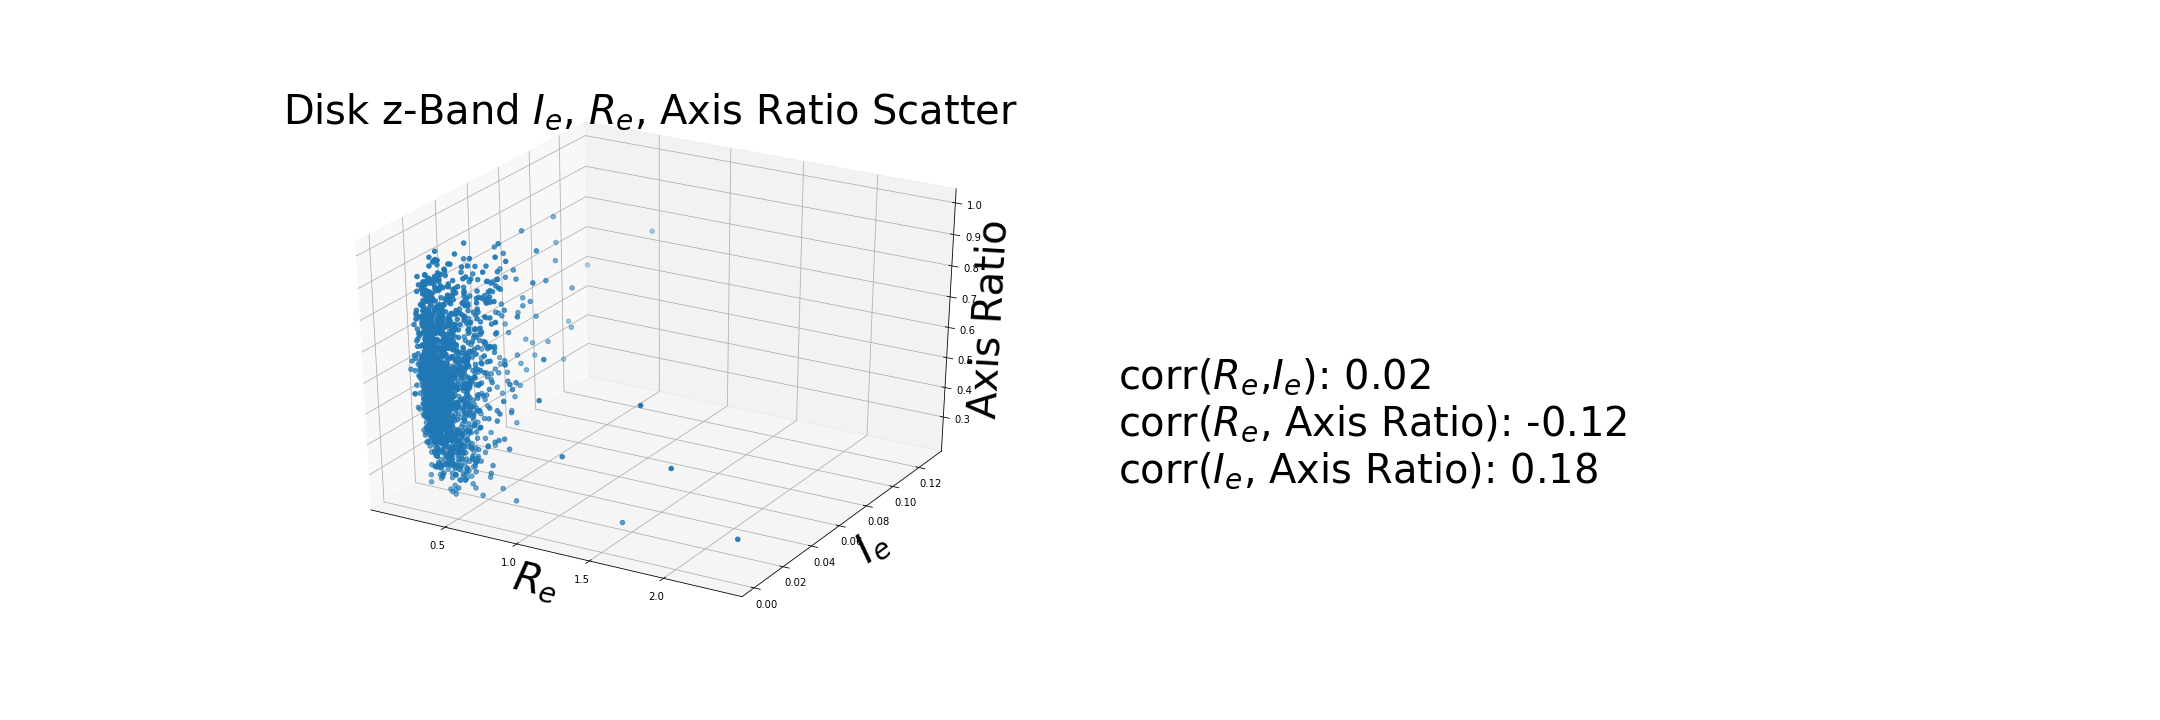
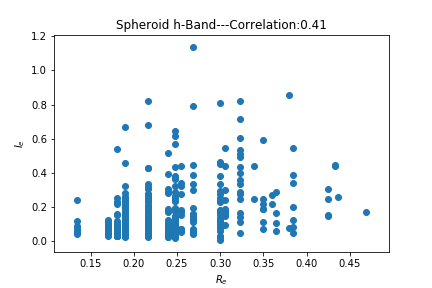
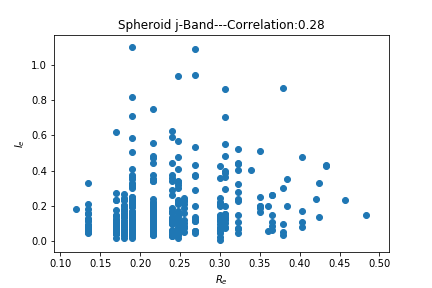
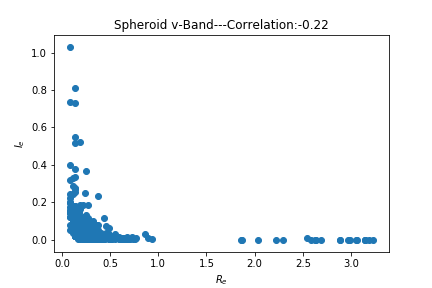
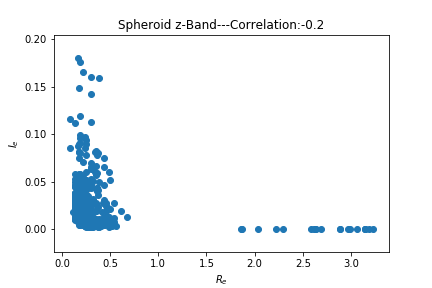
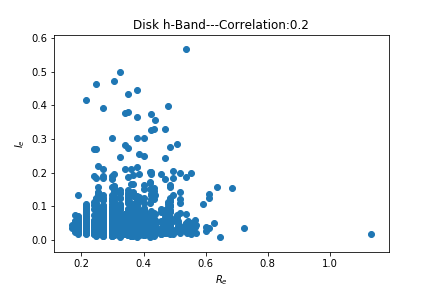
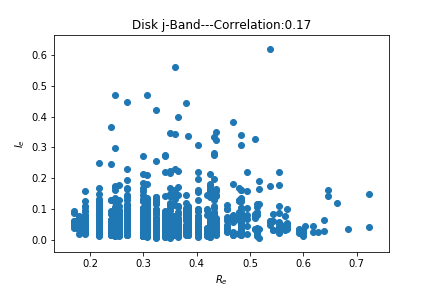
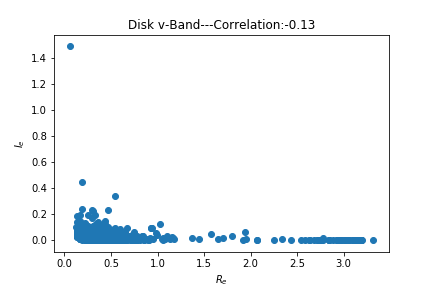
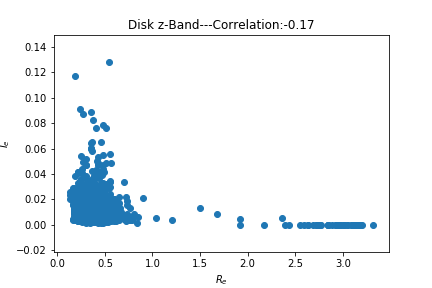
$I_e$ $R_e$ Scatterplot
The Pearson Correlation Coeffiecent is at the top of each graph in the title
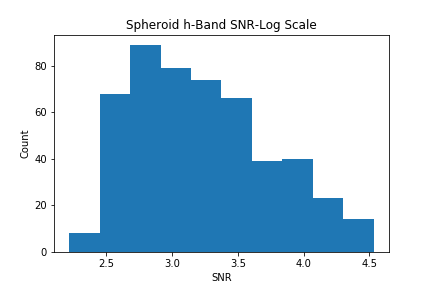
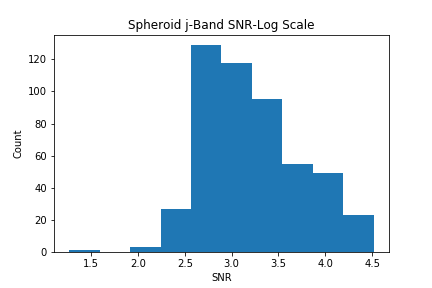
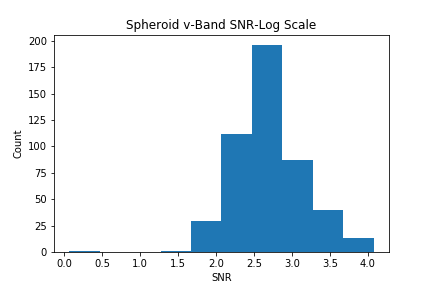
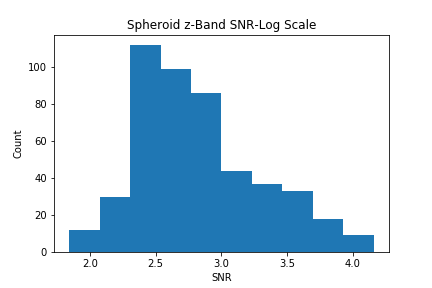
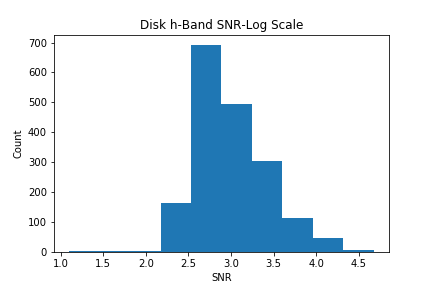
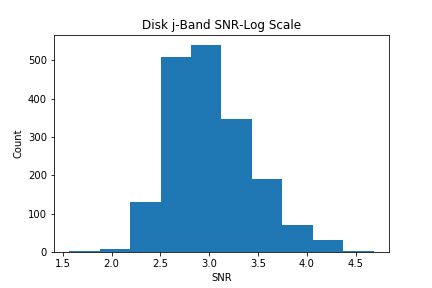
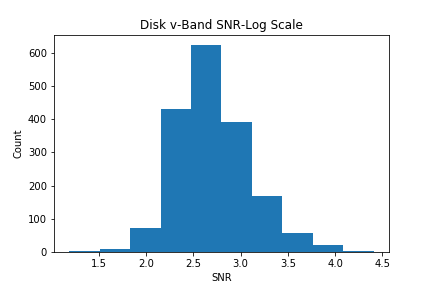
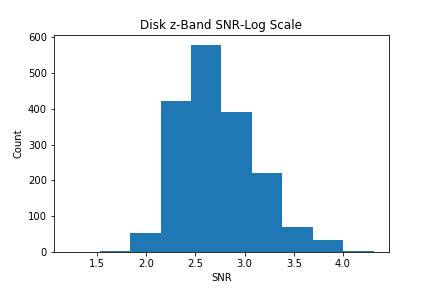
SNR in Logspace
There doesn’t seem to be a strong correlation between $I_e$ and $R_e$.
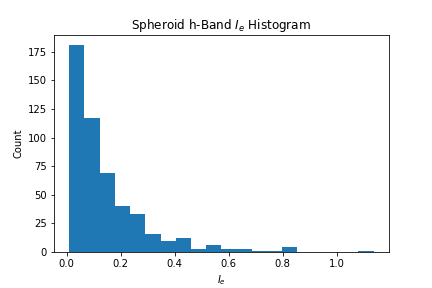
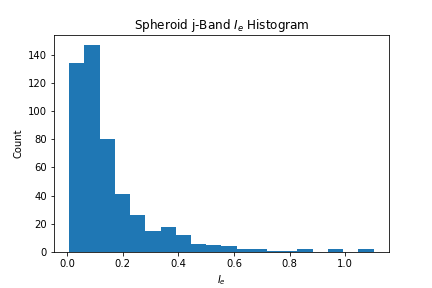
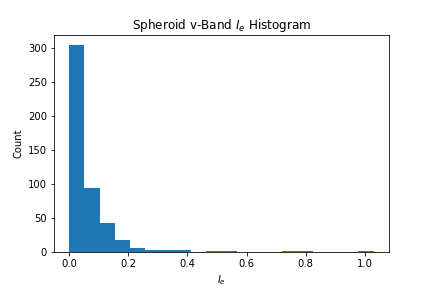
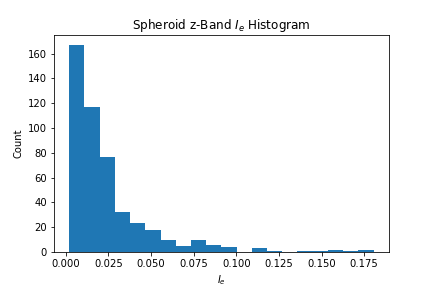
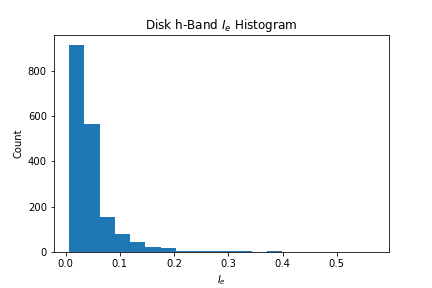
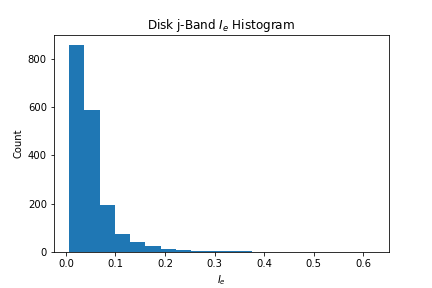
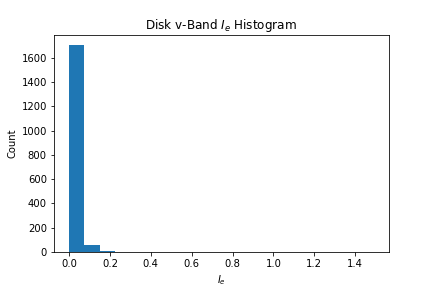
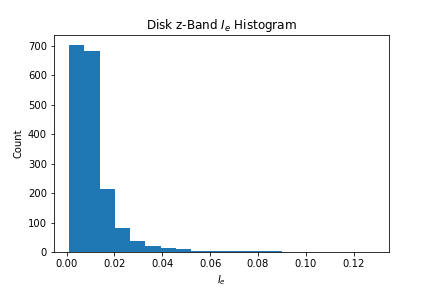
Hisograms from original data
Histogram $I_e$
Hisograms from original data
3D Gaussian of $R_e$, $I_e$, and Axis Ratio