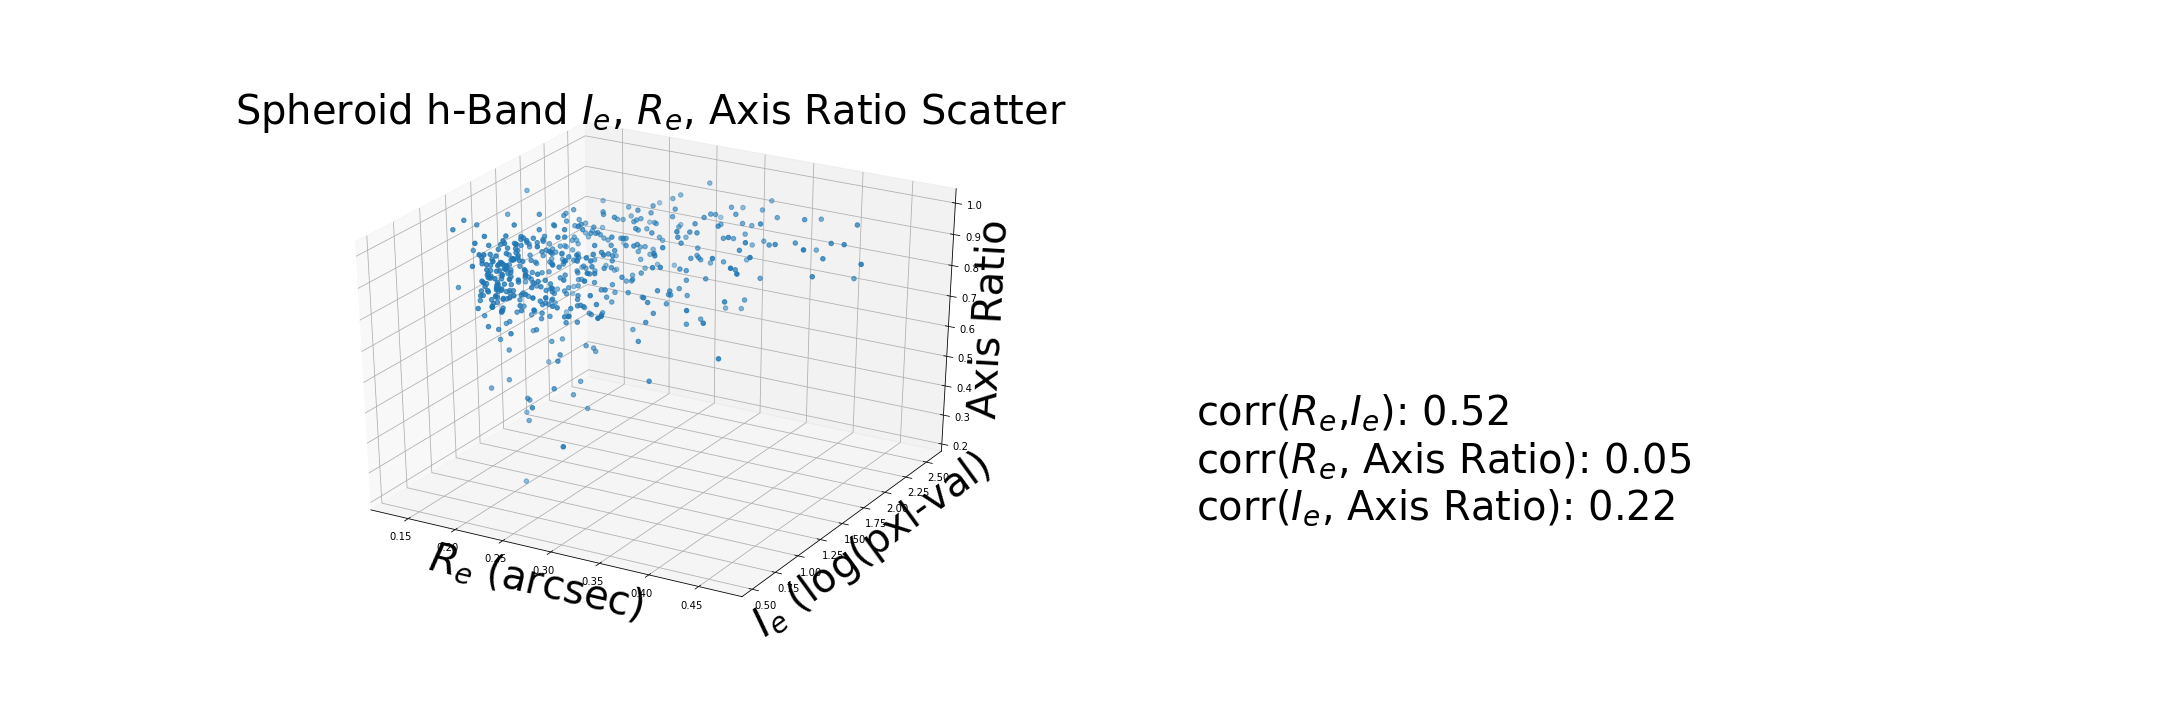
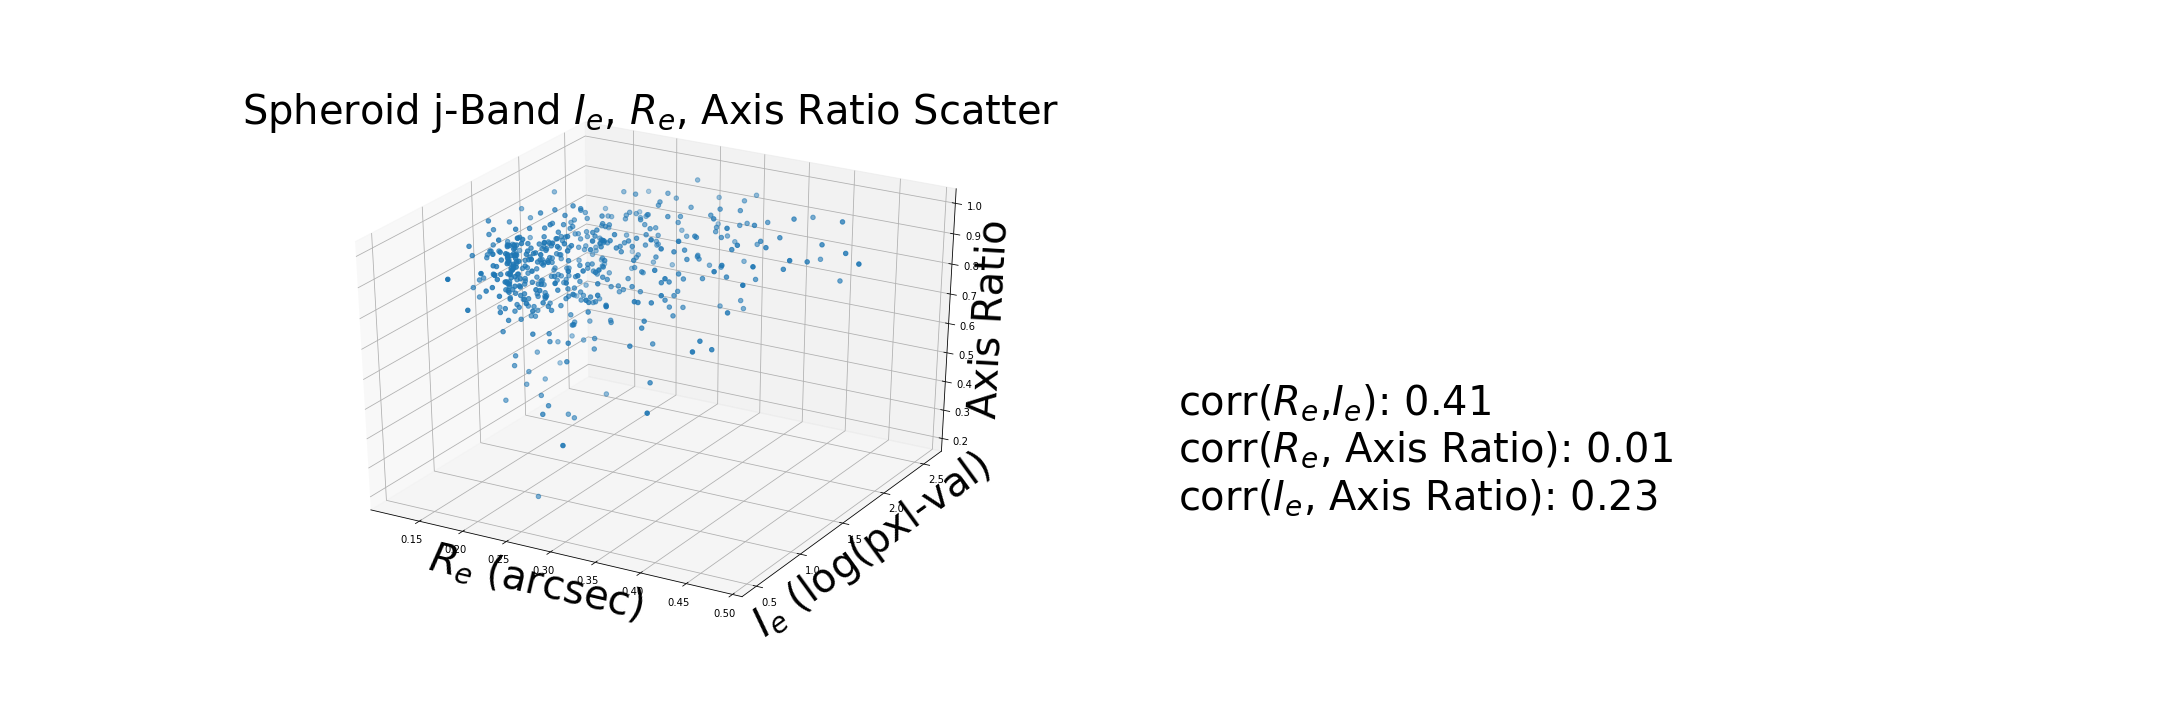
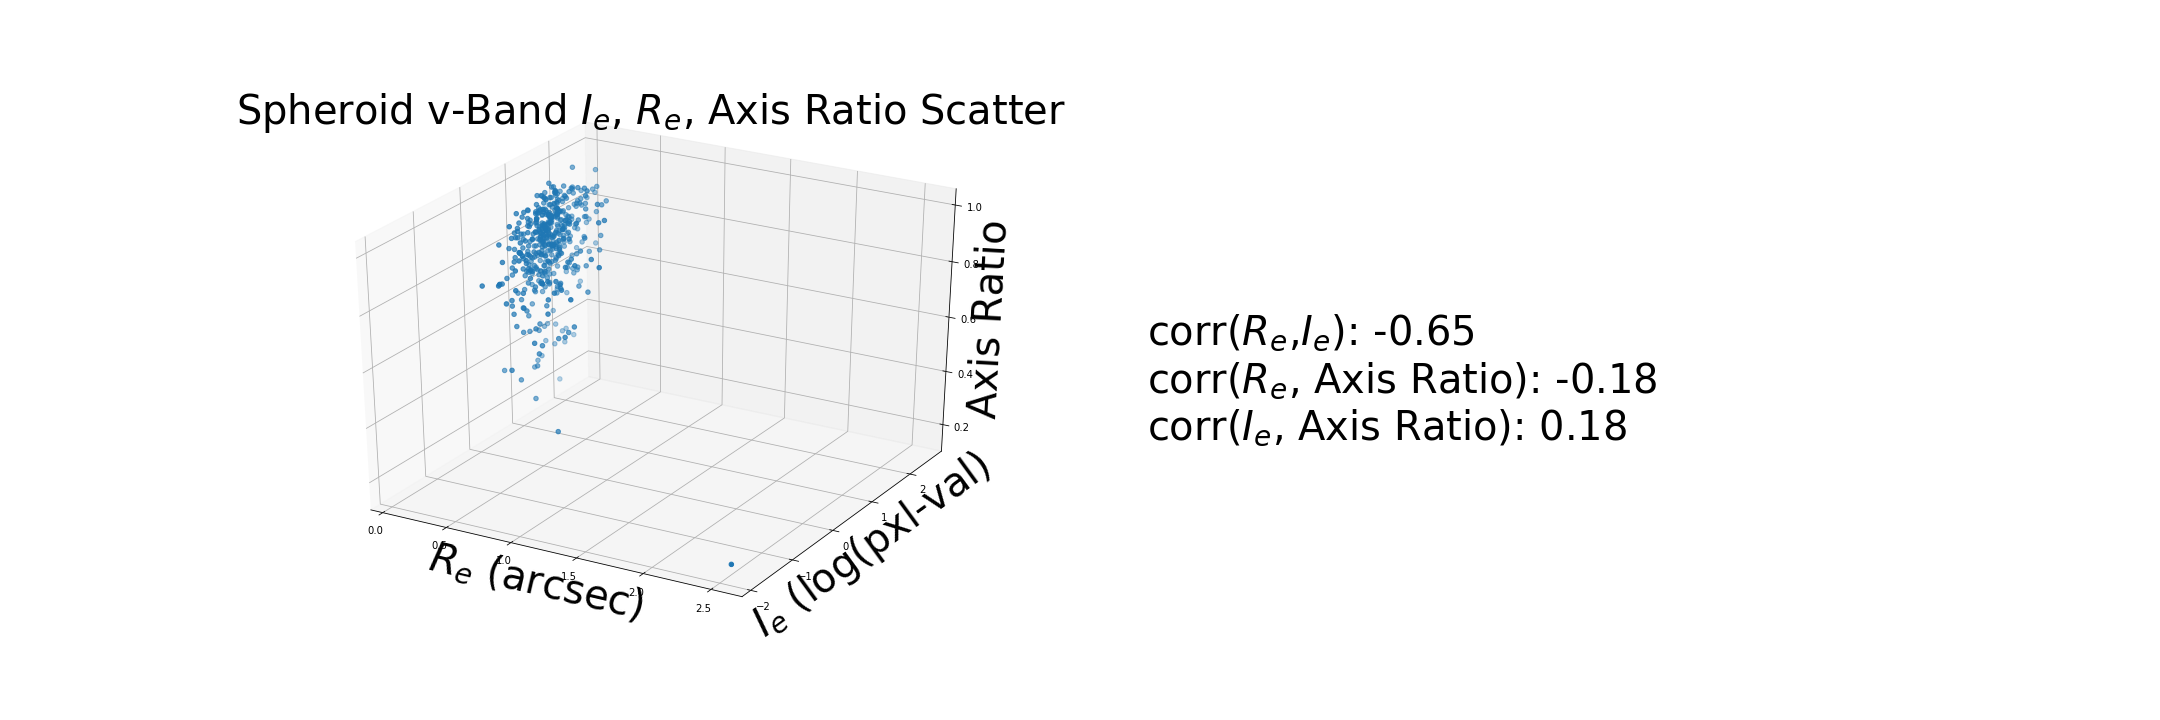
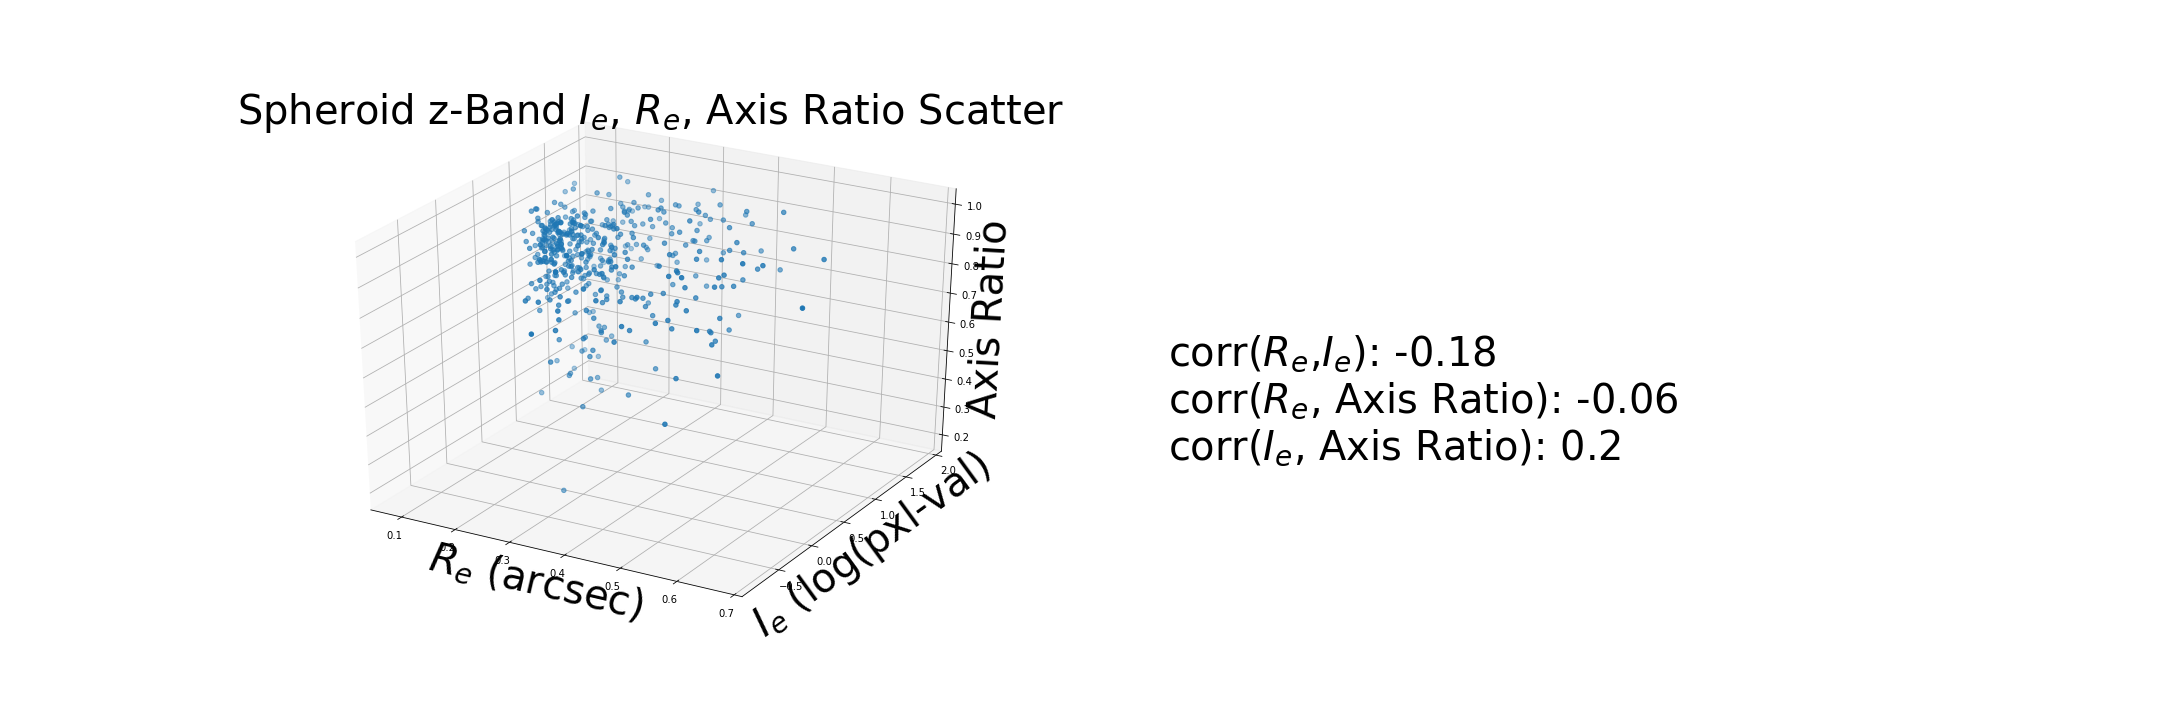
Update the formula for the calculation of Ie
These correlations are based on the new calcualtion for $I_e$.
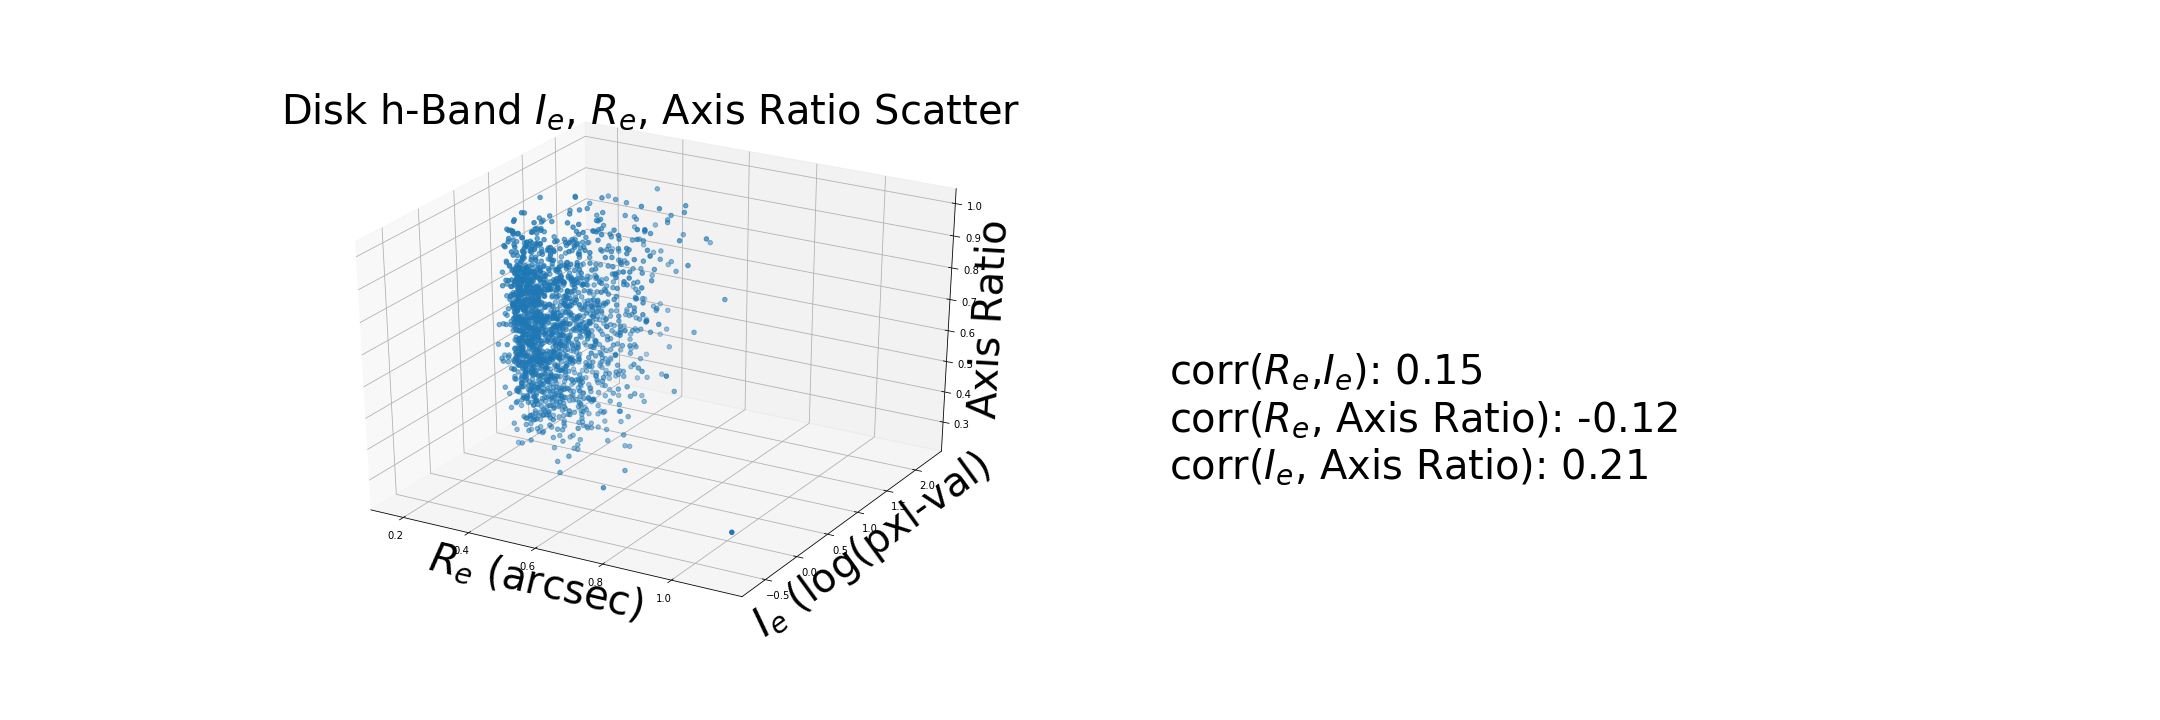
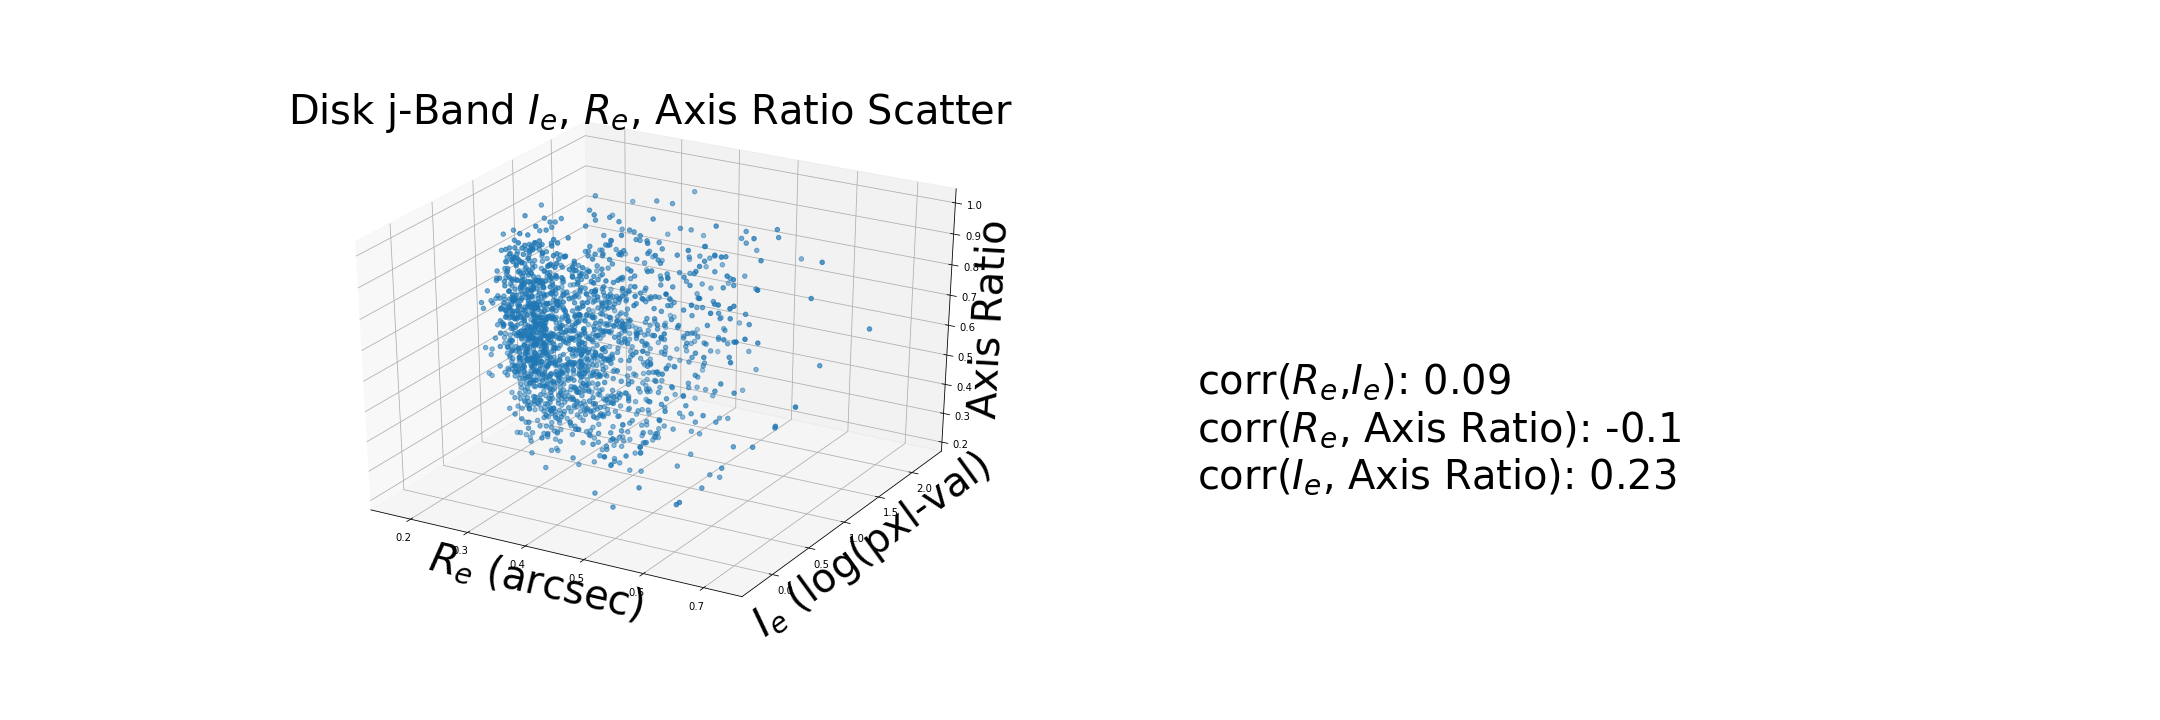
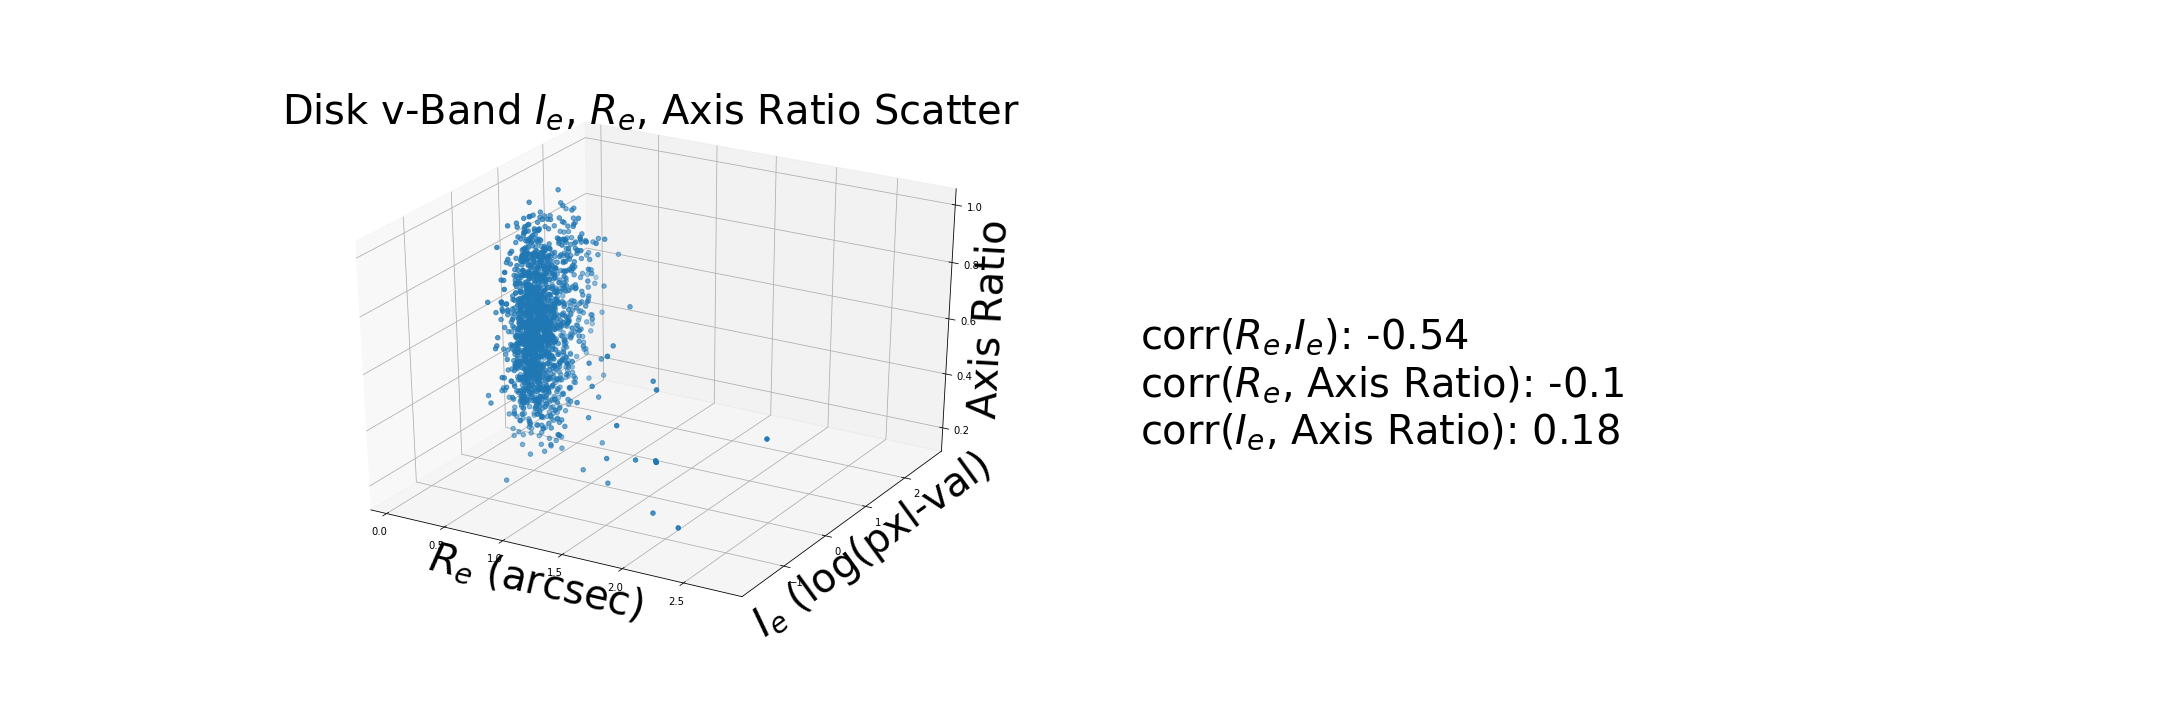
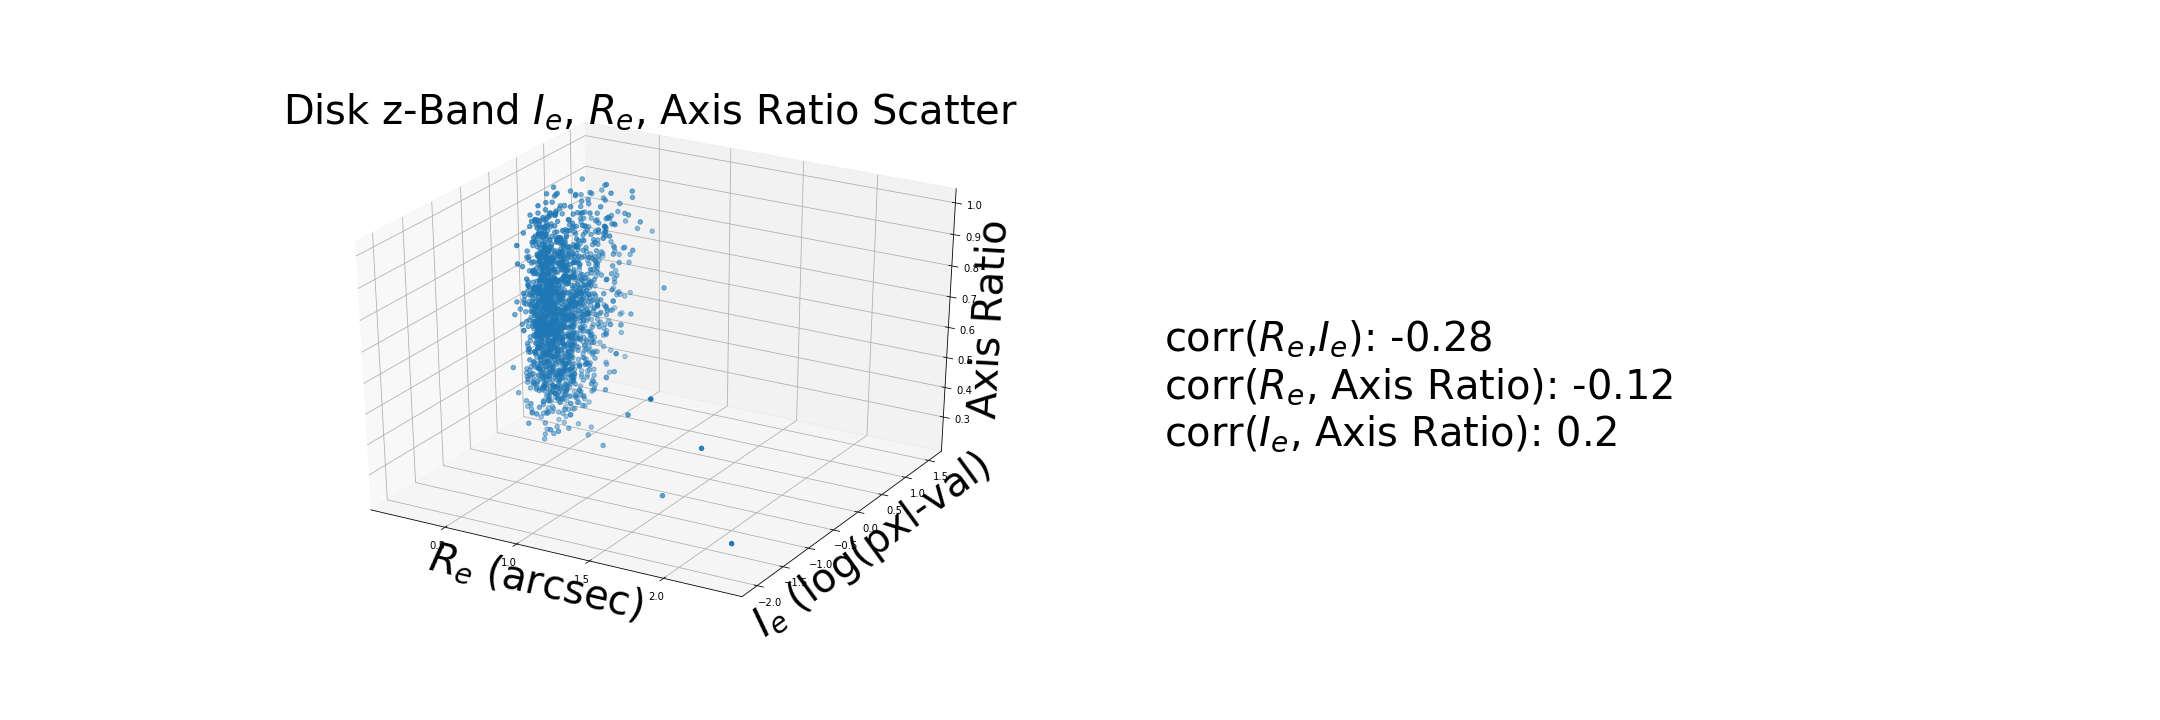
Generate a synthetic disk using the measurements of from a disk in the dataset and compare
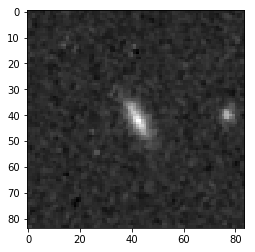
Here is a disk (Deep2_10006) in H band:
Measurements:
-
$I_e$: 10.665292718299387 ( ($\sum_r^{R_e}I_r) / 2\pi R_e^2$ )
-
$R_e$: 0.26832815729997478 arcseconds
-
Axis Ratio: 0.43909844078473159
-
Signal-to-Noise: 852.04977019270871 ($ (\sum_r^{R_e}I_r) / RMS(Noise), \text{where Noise is all } I_n \text{ where } n \in r>(3*R_e) \text{ and isn’t another source}$)
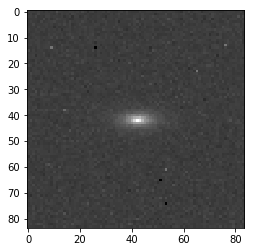
Here is a synthetic disk in H band created with its attributes:
Measurements:
-
$I_e$: 16.345316344 ( ($\sum_r^{R_e}I_r) / 2\pi R_e^2$ )
-
$R_e$: 0.2683281573 arcseconds
-
Axis Ratio: 0.58028294848
-
Signal-to-Noise: 842.252039586 ($ (\sum_r^{R_e}I_r) / RMS(Noise), \text{where Noise is all } I_n \text{ where } n \in r>(3*R_e) \text{ and isn’t another source}$)
Diff (Orig-Synth):
-
$I_e$: -5.680023626
-
$R_e$: ~0
-
Axis Ratio: −0.141184508
-
Signal-to-Noise: 9.797730607
I haven’t implemented a way to fit the image to a certain $I_e$ yet, which seems to be the largest discrepancy. I ran a few random draw and the numbers dance around a little
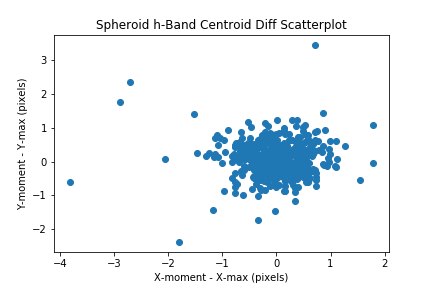
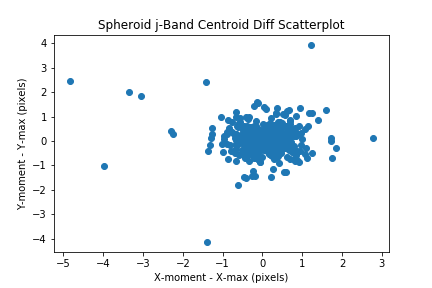
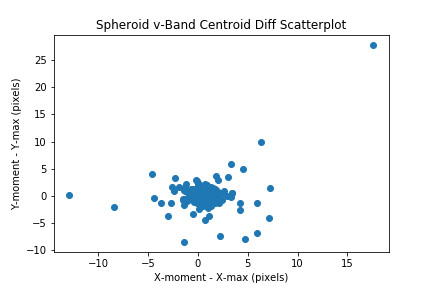
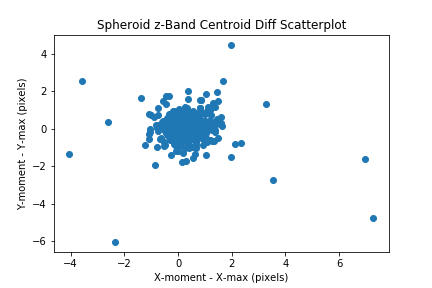
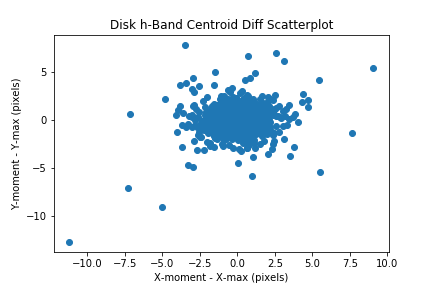
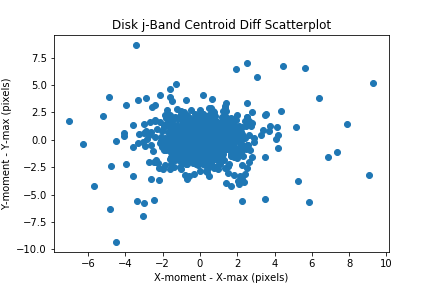
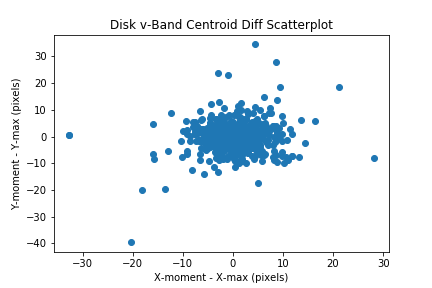
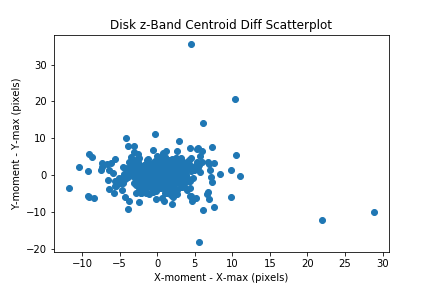
Compare the max pixel with the centroid by plotting the delta_x and delta_y values in a scatter plot