Exploring Different Kernel Functions for A Proper Fit
All the functions below include a additive noise term ${\Sigma_n}$ which represents the noise per datapoint along the diagonal of a matrix where are all other entries are 0.
All of the functions(excluding Squared Dot Product) also have a $\sigma_f$ parameter for scaling the kernel function
Disks
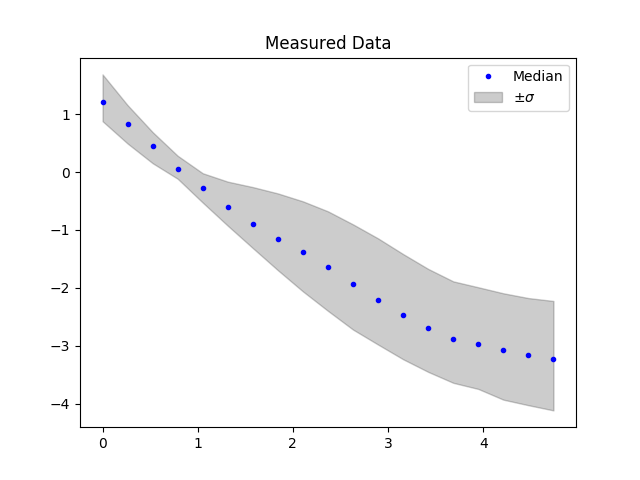
The data used for fitting each process is the measured values($16^{th}$, median, $84^{th}$) from the confident disks in the H band.
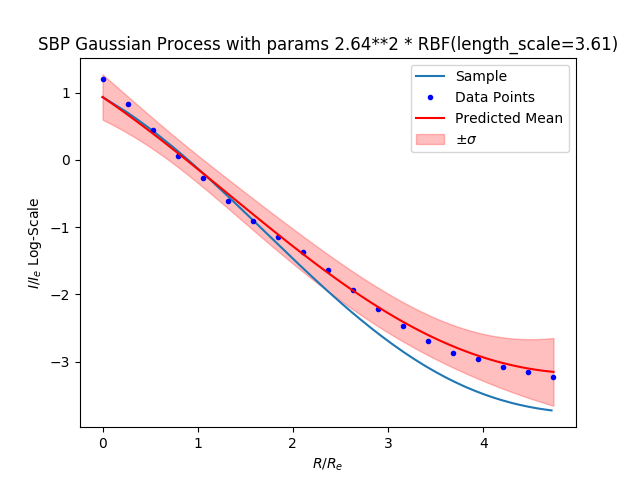
Radial Basis Function
Definition:
Where $l$ is the length scale paramter.
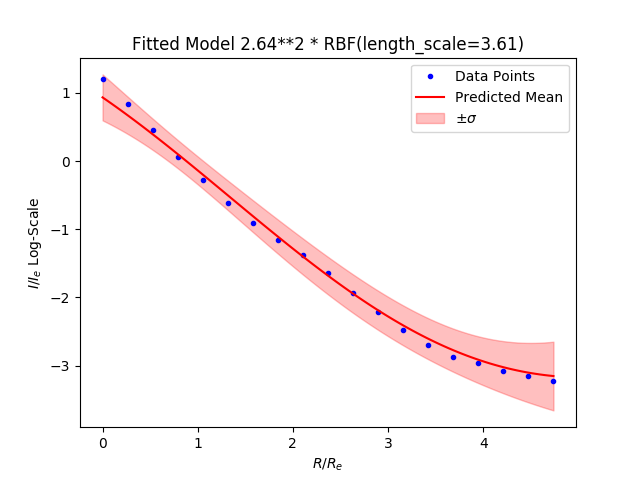
Samples from distribution:
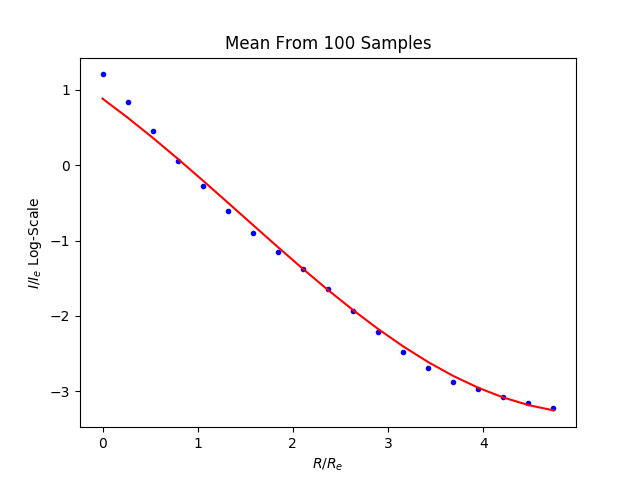

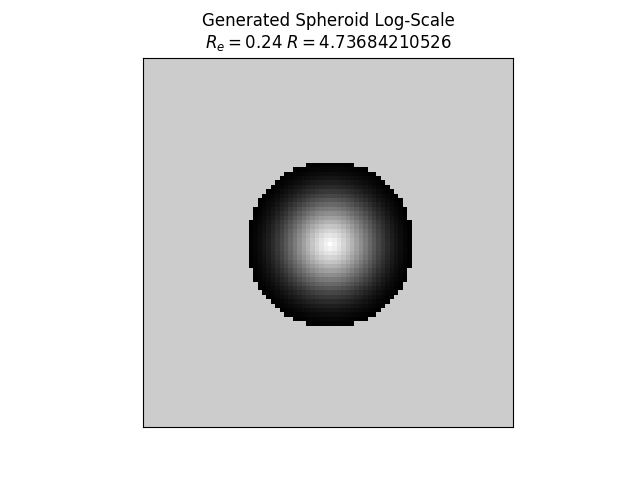
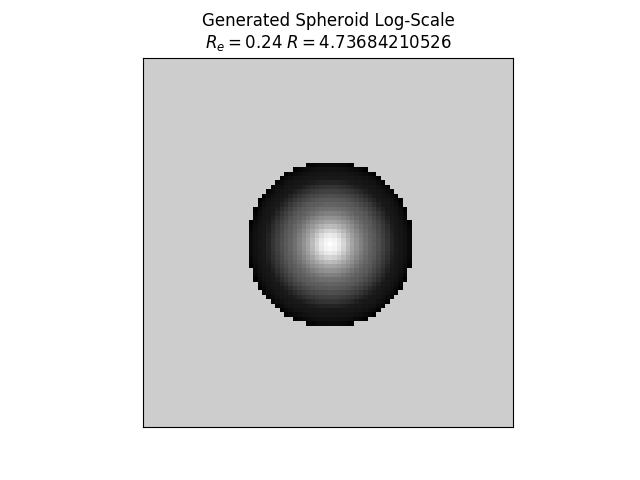
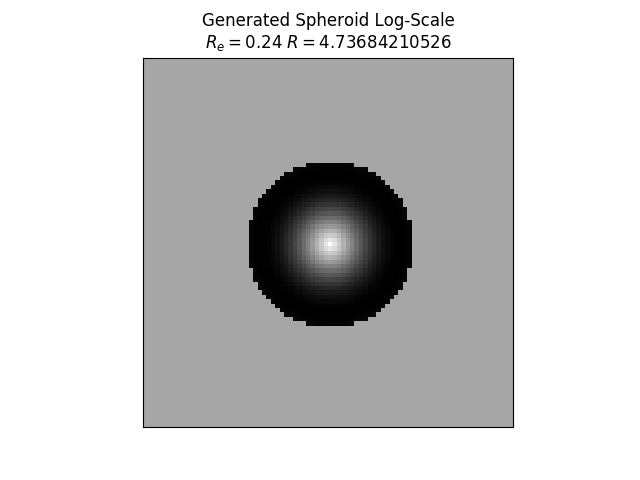
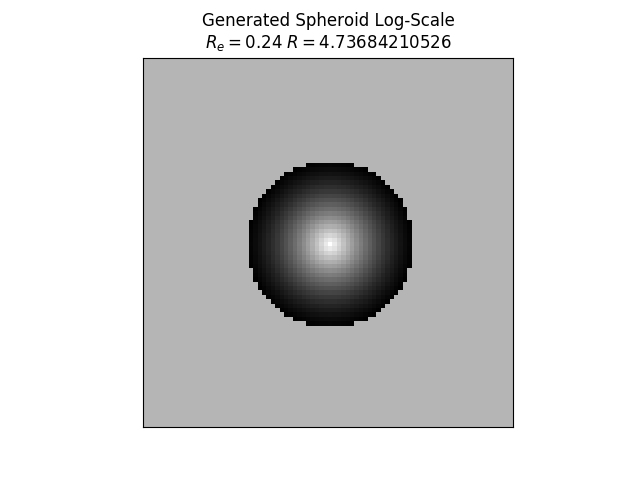
Image generated from the learned distriubtion and the samples path against the model:
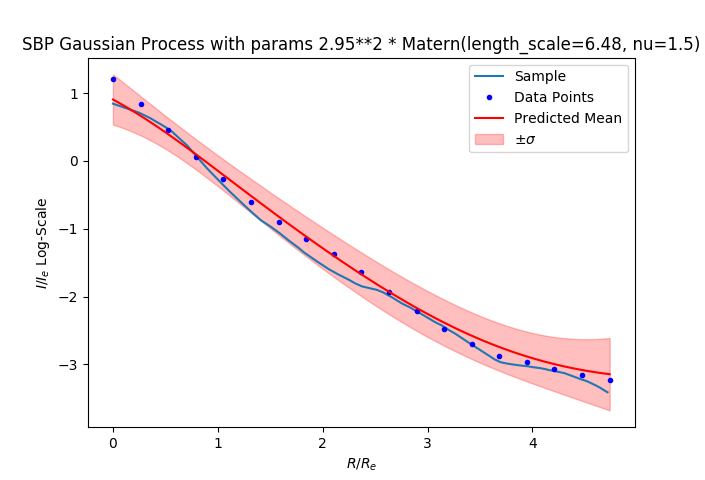
Matern
Definition:
Where $\Gamma$ is the gamma function and $K_\nu$ is the Bessel function, $l$ is the length scale, and $\nu$ is a non-negative parameter.
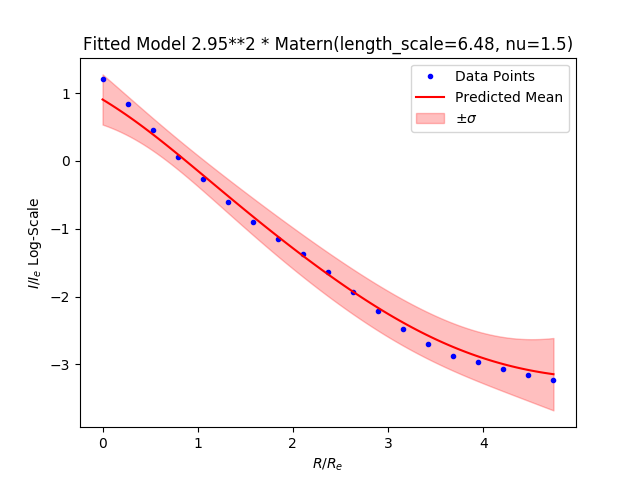
Samples from distribution:
Image generated from the learned distriubtion and the samples path against the model:
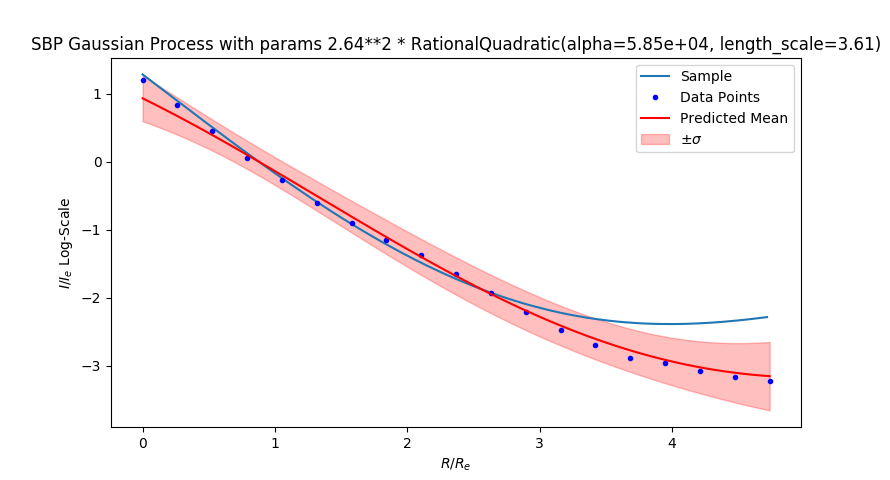
Rational Quadratic
Definition:
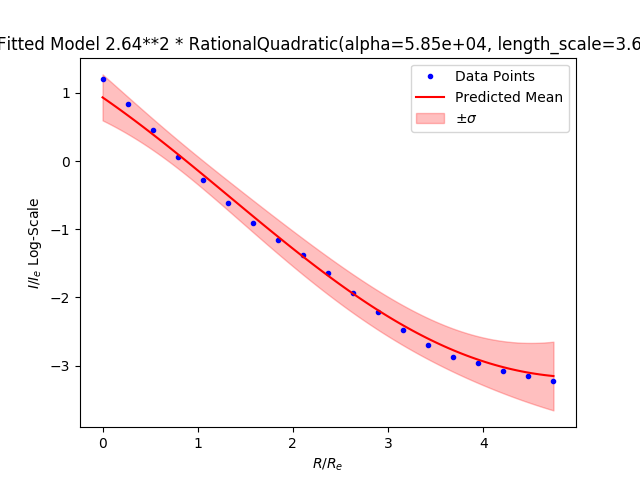
Samples from distribution:
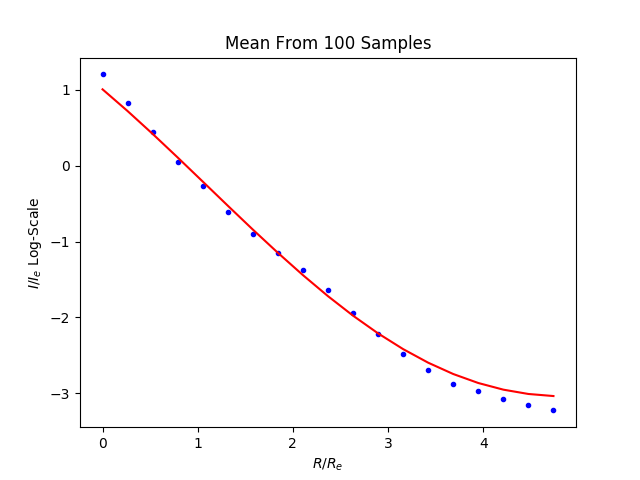
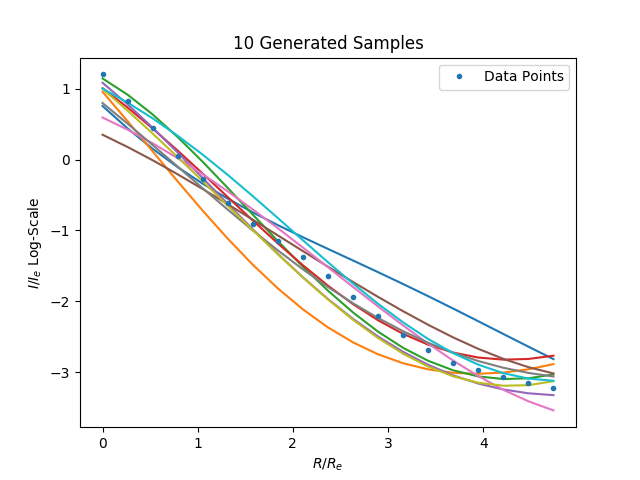
Image generated from the learned distriubtion and the samples path against the model:
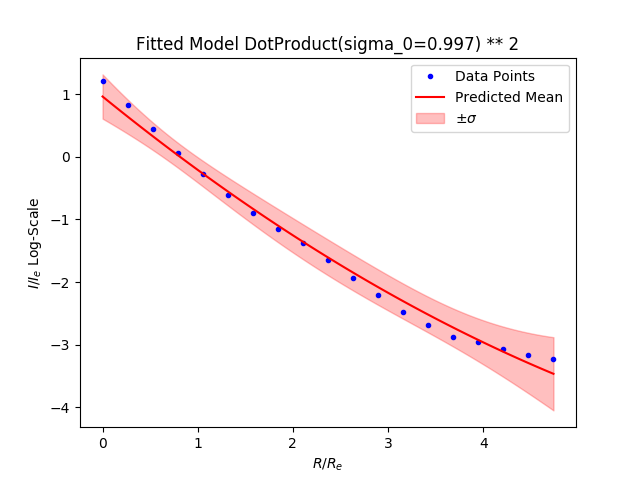
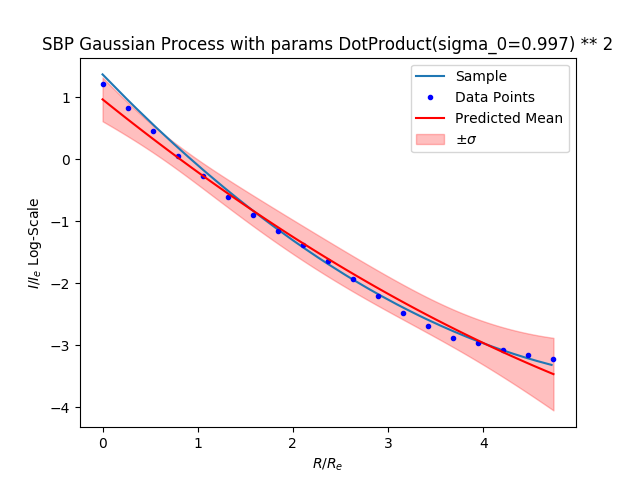
Squared Dot Product
Definition:
Samples from distribution:
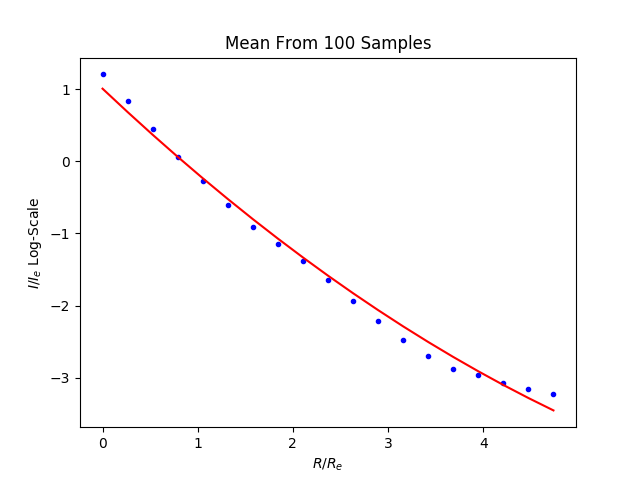
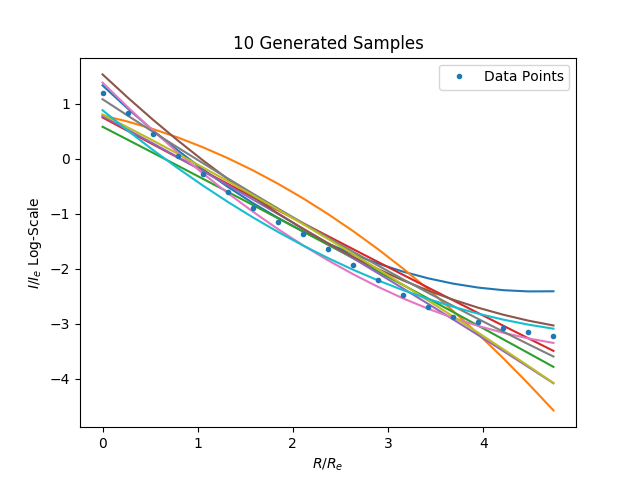
Image generated from the learned distriubtion and the samples path against the model:
Work in Progress
My main concern is that all of the kernel functions seem to be biased to values lower than the median as it moves closer to the center. This may not matter too much for disk objects, but for spheroid objects I think this will be more problematic. I ran the kernels for the spheroid surface brightness profiles and observed the same behavior. Right now, I am exploring, sums, products, and exponenations of kernels along with defining a new kernel function. I think we should be able to find something that works.