To create more accurate synthetic images for training the model we fit all the source images to a Sersic profile. Equation we use to define the Sersic profile is:
Where $m=1$ defines an exponential disk profile, $m=4$ defines a De Vaucouleurs spheroid profile, and $b_m=2m-0.324$
The parameters we want to fit are $I_e$ and $R_e$. Which will be optimized using fmin from scipy.optimize
import numpy as np

def sersic(Ie, Re, R, m):
    bm = 2.0*m - 0.324
	return Ie * np.exp(-bm * ((R/Re)**(1.0/m) - 1.0))

def get_surface_brightness_profile(img):
    """
    img: a two dimensional array, dims (84,84)
    """
    pix = 0.06 # arcseconds/pixel
    n_bin = 100
    center_dist = np.sqrt((0.5*84)**2 + (0.5*84)**2)
    r_bin = .06 * center_dist * np.arange(bins) / float(bins)
    I_bin = np.zeros(n_bin, dtype=float)
    norm_bin = np.zeros(n_bin, dtype=float)

    for i in range(nx):
        for j in range(ny):
            ix = np.abs(0.5*nx - i)
            iy = np.abs(0.5*ny - j)
            R  = np.sqrt(ix*ix + iy*iy) * pix
            idx = bisect.bisect_left(r_bin,R)-1
            if((idx<n_bin-1) & (idx>0)):
                I_bin[idx] += img[i,j]
                norm_bin[idx] += 1.0

    ip = np.where(norm_bin>0)[0]
    I_bin[ip]/=norm_bin[ip]

    return (r_bin, I_bin)


def sersic_optimize(x, m, y):
    """
	x: an indexed object with two items Ie=x[0], Re=[1]
	m: the m param for the sersic profile
	y: the measured surface brightness profile of the object
	"""

    pix = .06  # arc/pixel
    bins = 100 # number of bins
    center_dist = np.sqrt((0.5*84)**2 + (0.5*84)**2)
    r = .06 * center_dist * np.arange(bins) / float(bins)

    # get the sersic profile for Ie = x[0] and Re = x[1]
    s = sersic(x[0], x[1], r, m)

    # return the squared error
    return ((s[y>0]-y[y>0])**2).mean()
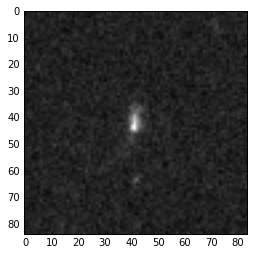
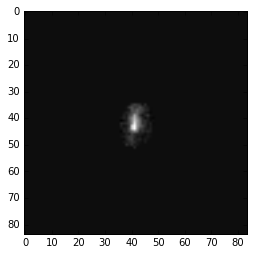
An example of usage for GDS_deep2_10016(disk) in the z band:
Original Image:
With noise removed:
Copy the values from these pages as string s in the code below to run it locally:
from scipy.optimize import fmin
import StringIO

# get segmap and image (The text is VERY long)
segmap = np.loadtxt(StringIO.StringIO("""
	PASTE segmap FILE CONTENTS HERE
"""))
img = np.loadtxt(StringIO.StringIO("""
	PASTE img FILE CONTENTS HERE
"""))

#remove noise
img[segmap==0] = 0.0

# get the measured surface brightness profile
_, y = get_surface_brightness_profile(img)

# get the fit parameters
m = 1.0
init_Ie_Re = [1.0, 0.3]
opt_vals = fmin(sersic_optimize, init_Ie_Re, args(m, y))

# The returned values should be [0.01934633, 0.24175975]
Graph of the measured surface brightness profile against the fitted surface brightness profile

Seems to fit the data. The quick drop-off is because we cut out the noise.
Here is a graph of the fitted values for spheroid and disk.
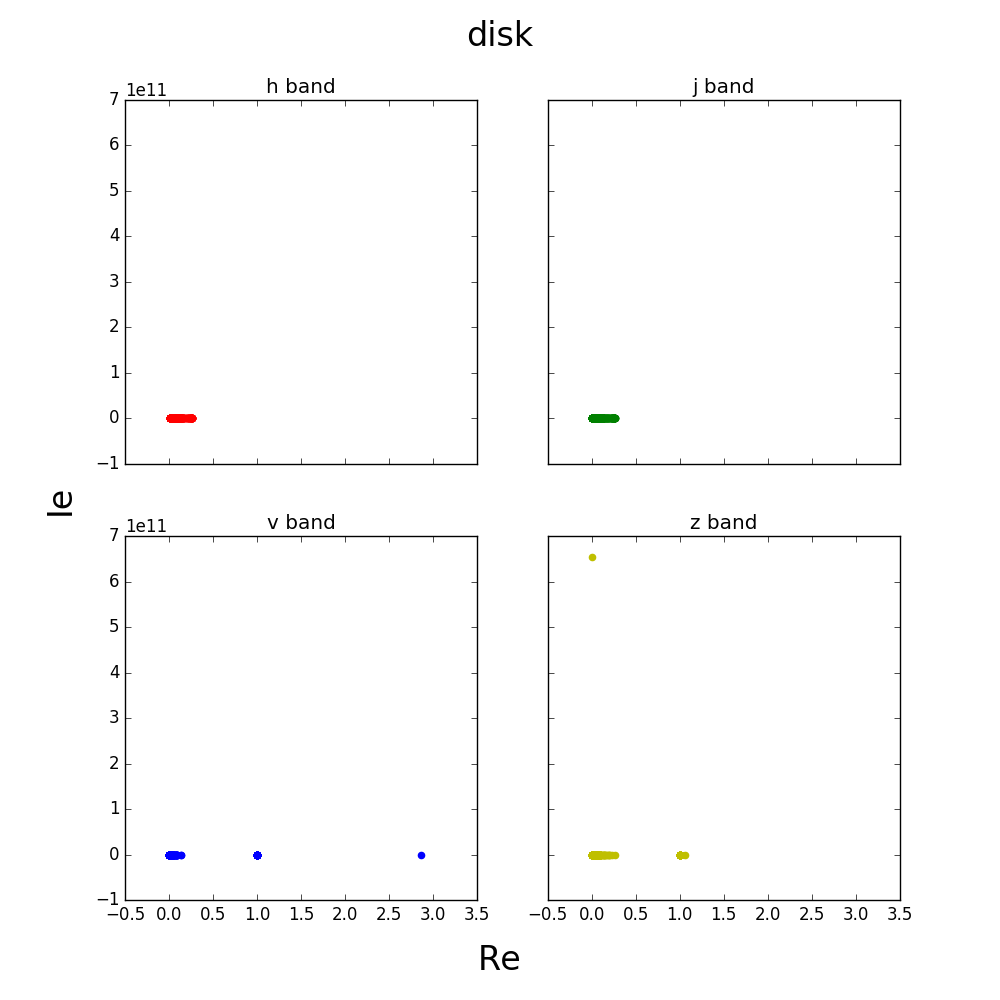
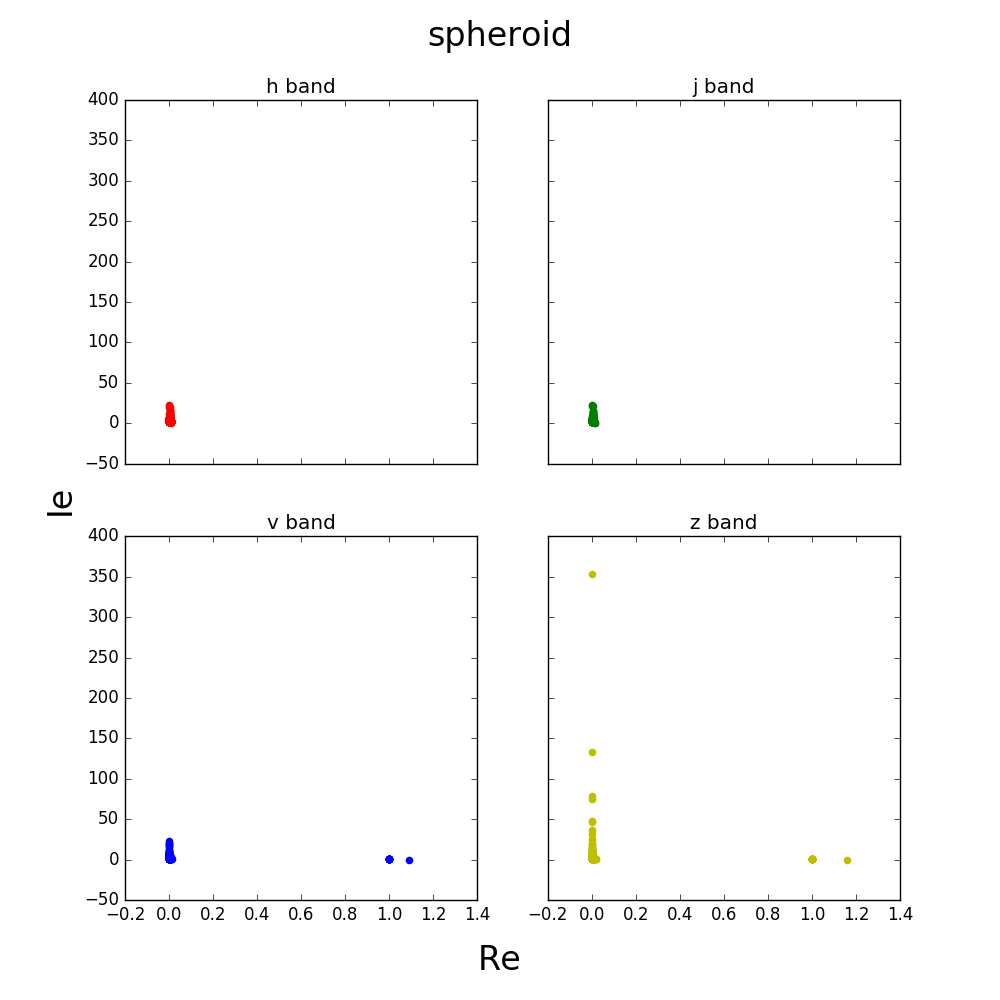
Some of the values seem to be outliers, here is a closer view of the graph.
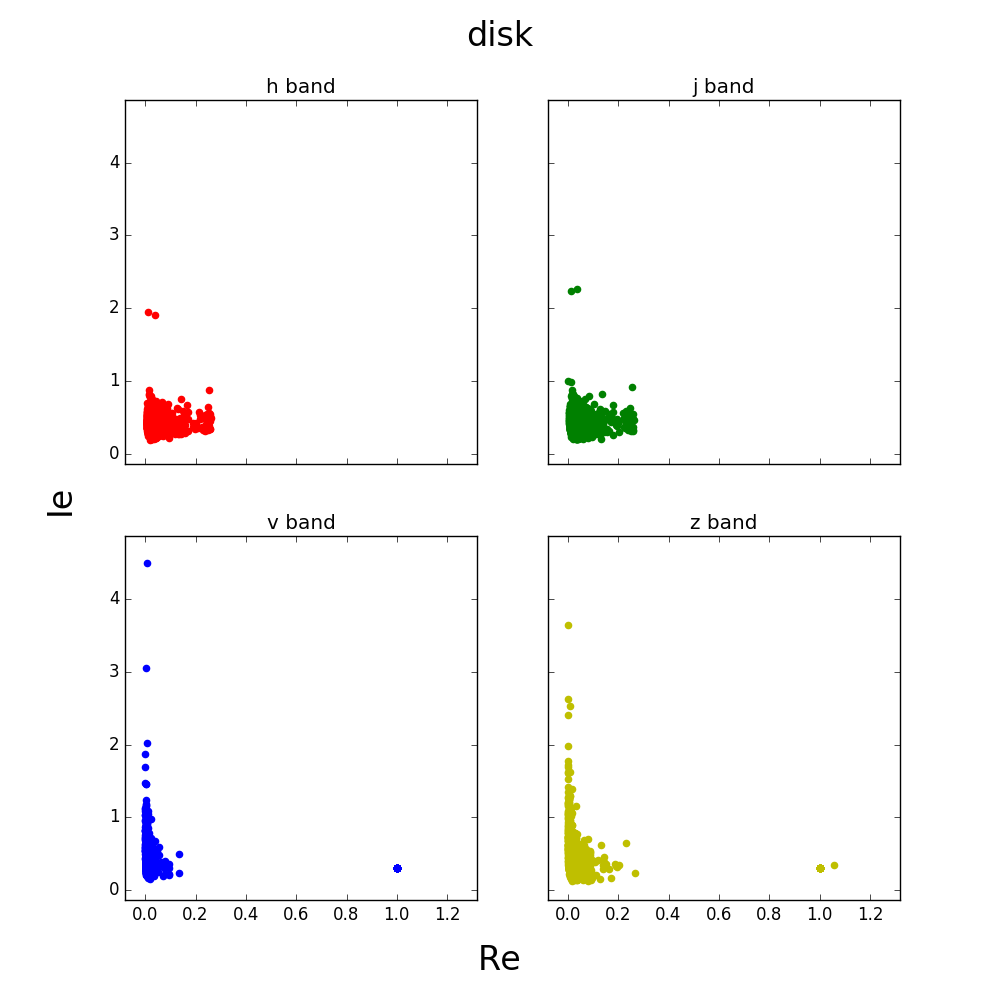
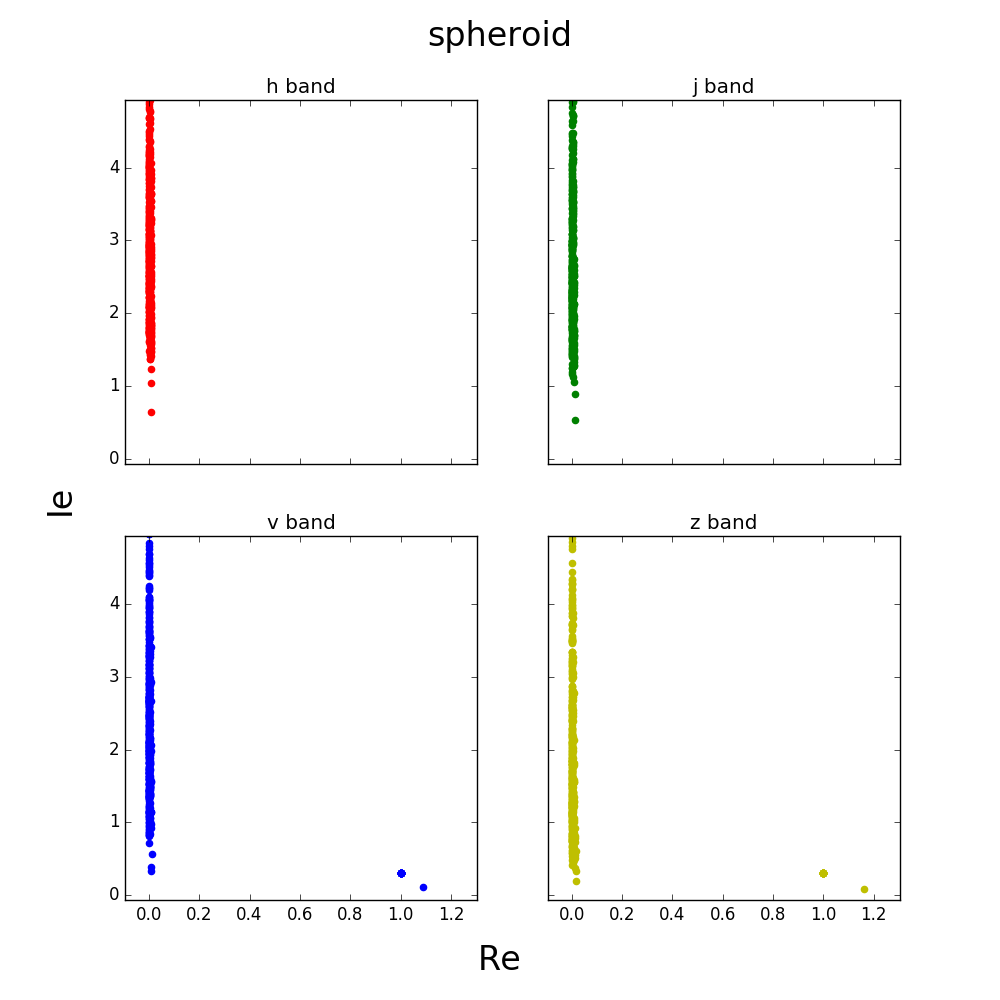
These graphs seem to make sense considering the morphology.